
Gold Trade Between East And West Follows 90 Year-Old Pattern
Submitted by Jan Nieuwenhuijs of Gainesville Coins
Gold trade between West and East still follows a ninety-year-old pattern. The price of gold is mainly set by Western institutional supply and demand, while countries in the East take the other side of the trade. As a result, above ground gold moves from West to East and back in sync with the price of gold decreasing and increasing. Knowledge of this pattern is imperative to understanding the gold market and the price of gold.
In the conclusion of my first article on the “West-East ebb and flood of gold,” published in January 2020, I wrote:
Don’t be surprised if in the current bull run London will absorb more gold, while demand in the East will grind to a halt. Some Asian countries possibly turning into a supplier.
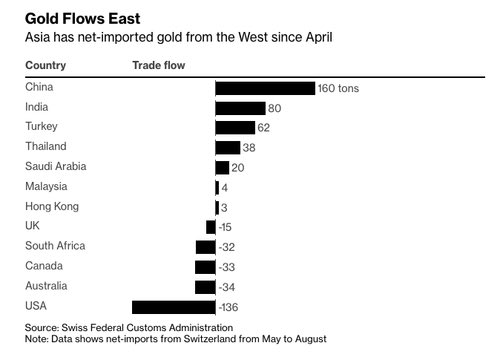
As we shall see, this is exactly what happened in 2020. Moreover, when the price declined from April until October 2022, the market went into reverse and the West dishoarded back the East.
Over the past ninety years there have been big movements in the ebb (metal flows from East to West) and flood (West to East) of gold. But the gold market is not always in a clear state of ebb or flood. Usually, it’s more nuanced than that. First, because the gold price is not always rising sharply or falling from a cliff. Second, the global gold market never stops evolving. In this article we will review the global gold market from early 2020 until late 2022 through the lens of the ebb and flood framework.
Introduction
In my article on the basic dynamics of gold supply and demand we discussed gold trades more like a currency than a commodity. Supply and demand numbers from consultancy firms are useful in their own way but incomplete. Because gold has a high stock-to-flow ratio (above ground stock divided by annual mine output), its price is set primarily by trade in above ground metal, as opposed to what’s annually mined versus newly fabricated products sold. Naturally, gold mine production does play its part in supply and demand. Mine output changes the amount of above ground gold in the long run. And miners never hoard metal but sell to where it can meet demand.
The above is step one in understanding the gold market. The next step is being aware of the ebb and flood pattern. A succinct definition of “the pattern,” extracted from my article The West-East Ebb and Flood of Gold, is set out in the subsequent chapter. How the pattern thrived after January 2020 will be explored in the chapter thereafter.
Recap of the Ebb and Flood of Gold
In general, economies in the East are financially less advanced than in the West. Whilst it’s considered normal in the West to keep all of one’s wealth within the banking system, people in the East are still accustomed to keep their savings partially in physical gold. Their ancestors saved in precious metals and so have they been taught. Jewelry, ornaments, and other gold products are used as gifts at weddings and childbirths, effectively rewarding reproduction. In the East gold is synonymous with survival.
The welfare state and financialization have slowly removed gold from Western people their day-to-day lives. People don’t pay much attention to gold when they feel financially confident. Western investment funds trade gold based on models ever seeking the highest yields in the shortest possible timeframe. Simplified, when investment confidence tapers off, for example due to rising inflation expectations, gold is bought, and when trust is restored, metal is sold.
In the East they don’t mind taking the other side of this trade. Close affinity with gold as a store of value makes Easterners price sensitive and have a long time horizon regarding this asset. Gold is bought in stable markets, but especially when the price goes down. Profits are materialized when the price is high. The West thus sets the price, and the East dampens volatility. Such are the dynamics that have transpired in the gold market over the past century or so.
West–East Ebb and Flood of Gold Still Active
Since January 2020 there hasn’t been an epic ebb or flood movement in tonnages, but the spirit of the pattern is as alive today as it was throughout its entire existence. For our present study it’s relevant to be acquainted with regional trading centers: in the East are Hong Kong, Singapore, and the UAE. In the West the UK (London), the heart of the global wholesale market, and Switzerland, the refining capital of the world as well as a storage hub. Mapping every gold trade of every country with every other country is impossible, so we will focus on the price differences and gold flows between key countries, trading hubs, and regions to expose the ebb and flood framework.
In 2020 the expected real interest rate in the US plunged, which boosted gold from $1,517 per troy ounce to roughly $1,900 by year end. As the pattern would suggest, the West was buying, and demand in the East collapsed with some countries selling. Our journey begins in China.
The People’s Bank of China (PBoC), which oversees the Chinese gold market, prefers the Chinese populace to hoard gold rather than dishoard, in order to safeguard China’s financial wellbeing. Gold export from the Chinese domestic gold market is restricted by the PBoC. Though it has no influence on the gold mentality of the Chinese people. As the gold price went up in 2020, supply pressures in China started mounting while gold couldn’t be exported. Gold in Shanghai traded at a steep discount relative to the London benchmark.
The gold price and the Shanghai premium, relative to London spot, persistently move in opposite directions. If the gold price rises, demand in Shanghai falls and the premium declines. If the price depreciates, demand in Shanghai strengthens and the premium goes up. The ebb and flood pattern in all its glory.
As indicated by Shanghai premiums, net gold imports into China often rise when the price declines and vice versa (see chart below). Remarkably, the Chinese are more sensitive to the dollar price of gold than the gold price in renminbi.
Trade statistics show China was a net exporter in April 2020, but I don’t think this was due to exports from the domestic market. A collapse in demand and small exports from Free Trade Zones (FTZs) resulted in a net export from the mainland*.
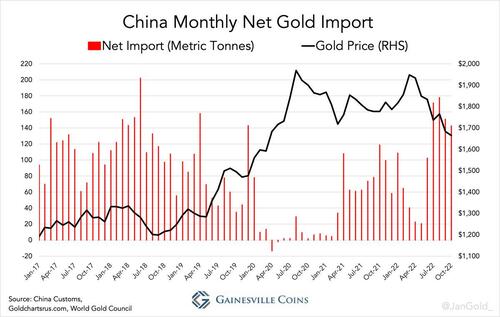
A collapse in demand in 2020 wasn’t because airplanes were hardly flying during the corona crisis—limiting how much gold could be transported to China—or we would have seen high premiums in Shanghai, not steep discounts. Neither did demand crash because of the lockdowns, which were chiefly around Wuhan that year. The main reason was the rising price, evidenced by a near perfect inverse correlation between the Shanghai premium and gold price.
The situation in India in 2020 was similar to China. Though not as accurate as in Shanghai, the average premium to London spot of gold prices across 14 cities in India, regularly moves in the opposite direction of the gold price.
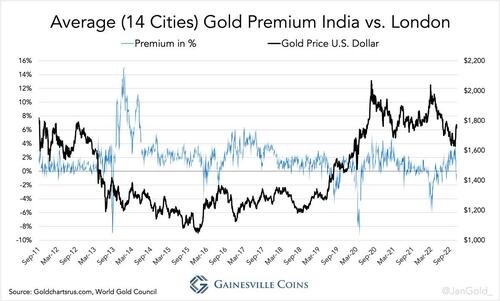
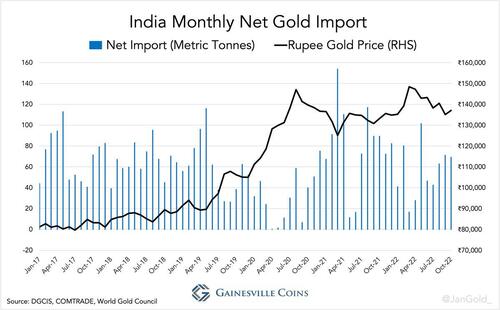
India too, since 2017, has restrictions on the export of gold bullion. Nevertheless, the pattern can be identified in a chart displaying Indian monthly net gold imports versus the gold price. The Indians are more sensitive to the rupee gold price.
A supportive illustration of the aforementioned dynamics in India and China was given by Jayant Bhandari, a financial consultant from India, in an interview for the Korelin Economics Report in July 2016. Indian demand for gold was falling in the months before the interview, on which Bhandari commented:
The demand for physical gold has basically stagnated in the country right now. It pays to remember that the Chinese and Indians are very value conscious. These are not the people that drive the price up. These are the people that consolidate the price. And once the price has gone up as much as it has in Indian rupee terms [the price had gone up 30% in 6 months], they lose their interest to buy gold. They want that price to stay there for a while, before they start thinking it will not go fall any further, and that’s when consolidation happens, and that’s when it creates a base for gold to go up, in their mind.
Let’s turn to Thailand, a country in the East that does allow bullion export. Because I didn’t cover Thailand in my previous article on the ebb and flood framework, I collected all gold trade statistics publicly available, which run from September 2011 through December 2020. The data shows that the gold market in Thailand aptly fits the ebb and flood framework.
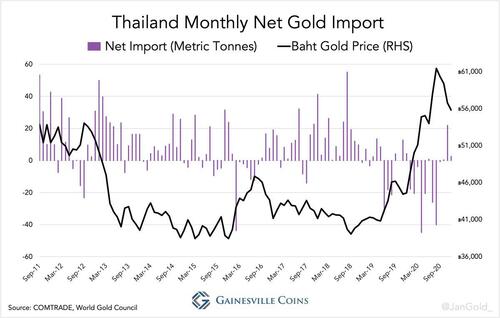
The chart above shows what gold author Timothy Green—the first to describe the ebb and flood of gold—observed forty years ago:
Many regional markets of the Middle-East and South-East Asia have shown remarkable sensitivity to sudden price movements. They go into reverse virtually overnight if the price soars and start dishoarding gold back to London or Zurich, often in significant amounts.
Reuters reported that Thailand was struck by the corona crisis and people sold gold to raise cash in 2020. To an extent this is true, but we can’t ignore Thailand was also a net exporter in just about any month the price went up in years prior to 2020. And in March 2022, when gold rallied to a near all-time high, Thai media wrote:
People in Thailand’s capital queued up this morning at gold shops along the Yaowarat Road, widely known as Bangkok’s Chinatown, to sell their gold for cash, because gold prices continue to reach new heights…
Thailand mostly exported gold Singapore and Switzerland in 2020.
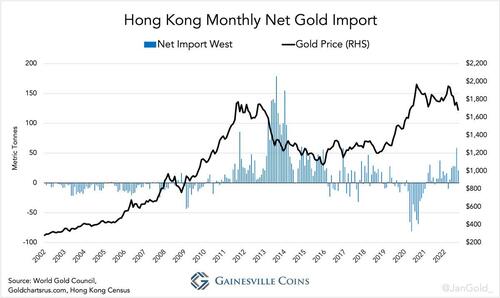
There hasn’t been massive dishoarding from the East in 2020. Via Singapore 120 tonnes were transported to the US and UK. Nearly 400 tonnes were shipped to Switzerland, the US, and UK from Hong Kong.
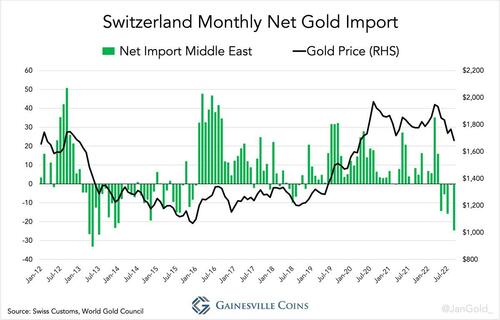
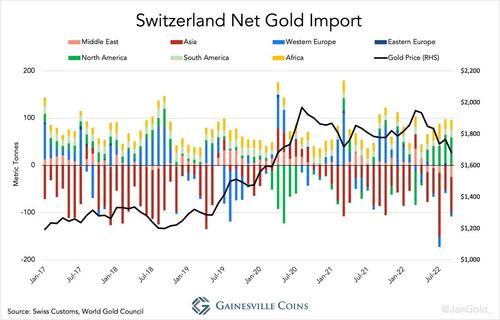
Via the UAE approximately 130 tonnes arrived in Switzerland. The pattern can be recognized in Switzerland’s net flows with the Middle East, which includes the UAE. Viewed from the Swiss side these flows are the opposite from what we saw in previous charts—Switzerland’s net imports are positively correlated with the price—as the price is set in the West.
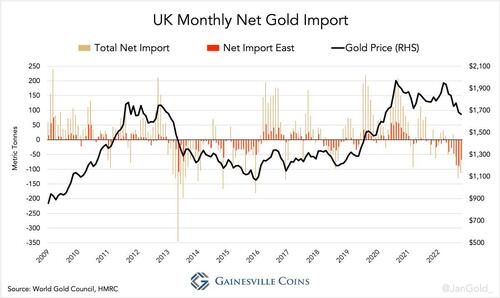
Switzerland in total net imported 300 tonnes in 2020, while the UK, where Western institutional money stores most of its gold, in total net imported a whopping 1,175 tonnes. The UK’s gold trade is virtually all reflecting wholesale supply and demand from the London Bullion Market. British retail demand is insignificant, and no gold is mined in the UK.
The chart below shows the UK’s total net imports and its net trade with the East. The latter breaths at the same pace as the former, both in sync with the price. This is the clearest manifestation of the ebb and flood of gold there is, by no coincidence in the core of the global wholesale market.
Gold trade between the UK and the East is additionally routed via Switzerland. As London strictly accepts 400-ounce gold bars, and bars in Asia routinely weigh much less, the giant Swiss refineries convert bars to accommodate the tide. From the trade statistics at my disposal, however, it appears the UK was a net exporter to Switzerland in 2020. Why?
My guess is that the dislocation in the gold market due to the corona crisis was the cause. Around March, governments on all continents implemented lockdowns and airliners were grounded to stop the virus from circulating. An unintended consequence was that gold, ordinarily carried on passenger flights, was temporarily immobilized. The spread between the gold price in London and on the COMEX in New York started widening because futures shorts exited their positions, driving up the futures price, but arbitragers were hindered to close the gap.
For whatever practical reasons, bullion banks decided to charter cargo planes and sent substantial amounts of “large bars,” perhaps borrowed from central banks, from the UK to Switzerland in April and May. In addition to other gold sourced throughout the year, from the Middle East and Asia, gold in Switzerland was mainly cast into 100-ounce bars for selling on the COMEX in the US at a hefty premium.
Next to dishoarding by the East, mine output from Russia, Canada, Uzbekistan, Australia, and South Africa was imported by the UK in 2020. The United States net imported 220 tonnes in total.
The corona crisis turned 2020 into an unusual year, to say the least. But it wasn’t the lockdowns or other anomalies that made gold flow from East to West. In all of the charts above that include data into 2022 it shows the market went into reverse, from ebb to flood, during gold’s decent in 2022. Premiums in China and India went up as well as their net imports. And Switzerland, the UK and the US were dishoarding to the East. The pattern was still effective in 2022 and so too 2020. The primary reason for the gold movement from East to West in 2020—and from West to East in 2022—was the price of gold set in the West.
Of course, there are numerous exceptions to the pattern. At the time of writing, i.e., the Egyptian Pound is in a free fall and people are buying anything they can, real estate, automobiles and gold, to protect their savings.
Conclusion
The ebb and flood framework provides clarity when observing the gold market. News that comes out about gold exports from Switzerland to countries in the East, or local premium statistics, can be easily put into context if one is familiar with the pattern. Additionally, it helps us to better understand the price of gold. How much gold bangles Chinese housewives are buying won’t give us a feel for where the price is going. As long as the pattern exists, we are better served by analyzing what happens in the West.
As the world’s most liquid spot market, the UK’s net physical flow is what basically drives the price of gold. Derivatives markets have a major impact on the gold price, but the forces from those markets are translated into physical buying and selling by arbitragers in London. Only physical supply and demand can change the price of physical gold.
From 2006 until early 2022 the gold price was inversely correlated to the expected real yield on 10-year US government bonds. This yield is equals the “10-year TIPS yield.” TIPS yield up, gold down and vice versa.
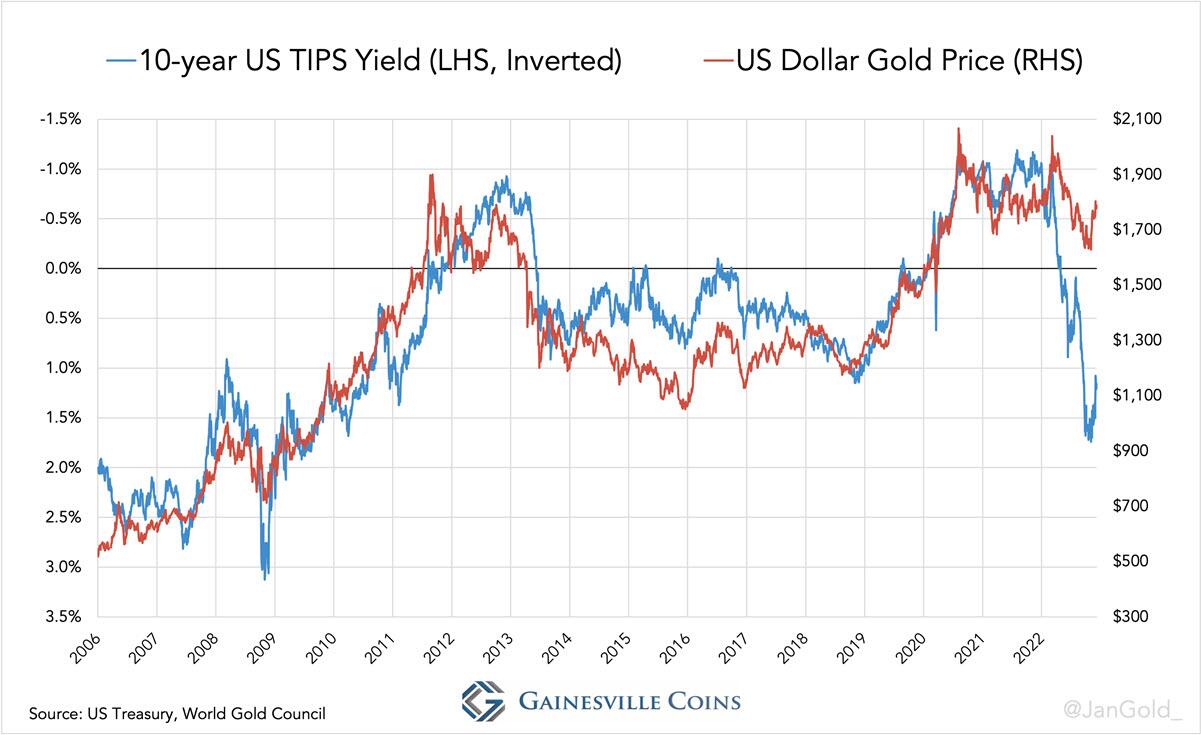
I wrote this January that to me this gold pricing model seems asymmetrical and unsustainable. Since February the correlation between gold and the TIPS yield started weakening. Gold went down from April until October 2022, though not as far as the TIPS yield prescribed.
Because we have assessed in the previous chapter that the West still drives the gold price, the change in how gold is priced must primarily originate in the West. The data substantiates my conclusion.
Let’s first have a look at the relationship between the UK’s net gold flow and the TIPS yield in 2022, versus 2013 when the TIPS yield also swiftly surged.
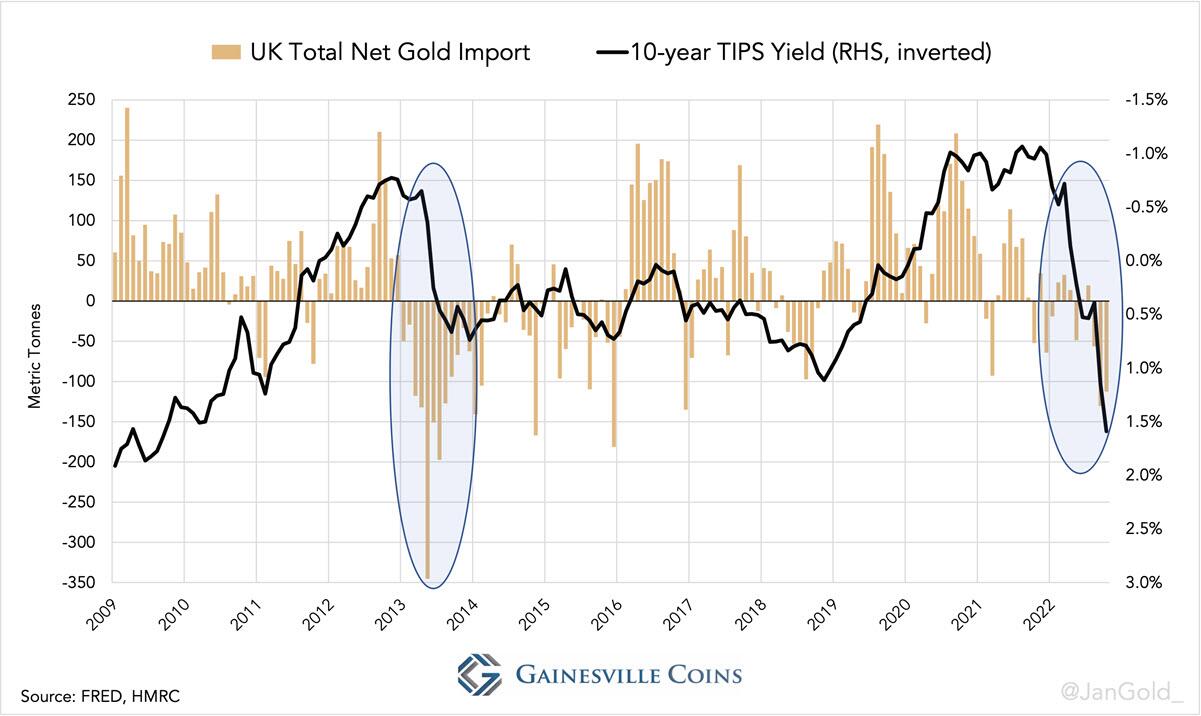
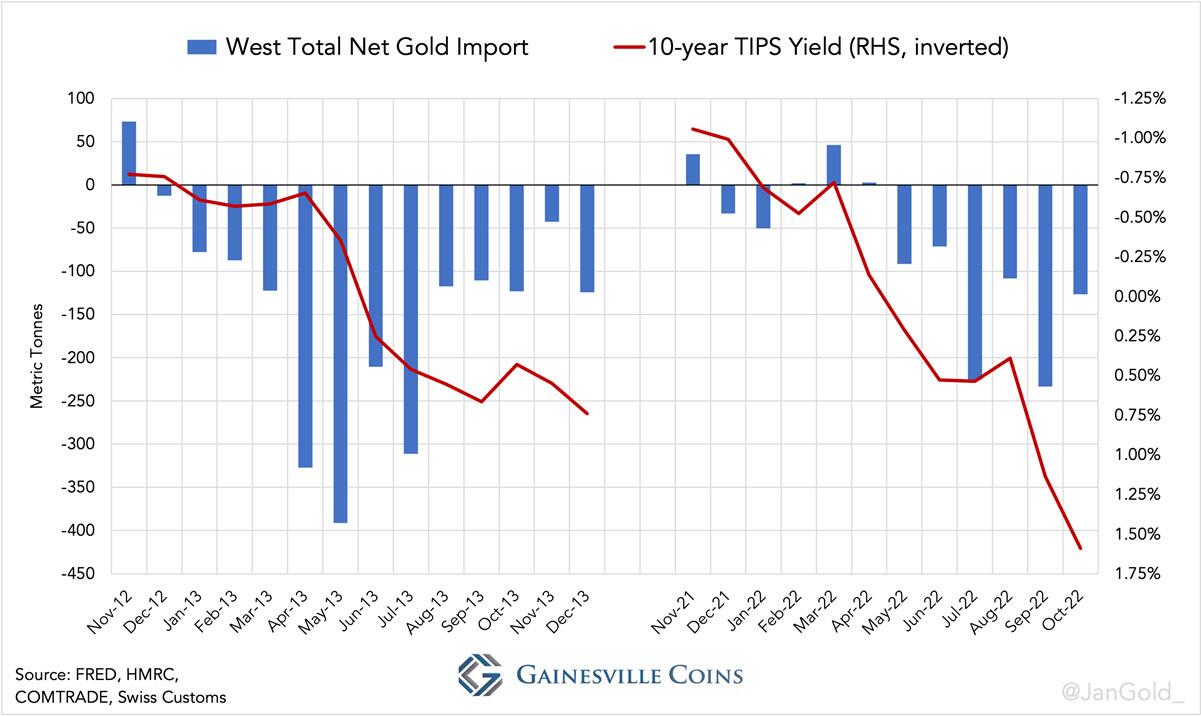
During 2013 when the TIPS yield rose sharply (+1.5%) the UK was a huge net exporter. In one month, May 2013, London dishoarded 345 tonnes. While the TIPS yield made a bigger move up in 2022 (+2.5%), London’s net sales were much lower than in 2013. Net export from Switzerland was also lower in 2022 than in 2013. The US net exported more in 2022 than in 2013, but not enough to make up for the West’s total
In 2022 the West dishoarded about half of what it did in 2013. My conclusion is that the West is still in the driving seat but is changing how gold is priced to the upside. I see this as a bullish sign.
Footnotes
*In this article I have exclusively used HS code 7108 (“gold, including gold plated with platinum, unwrought or in semi-manufactured forms”) for all trade statistics. If gold in jewelry form (HS code 711319) would be included the cross-border trade numbers would look different. In China’s case, for example, bullion (7108) is imported into FTZs, manufactured into jewelry, and exported (711319). My chart doesn’t show the jewelry export and thus total net import looks higher. This explains why China seemed to net import small amounts of gold in 2020 while the Shanghai premium was deeply negative. The difficulty with measuring the gold in jewelry trade is that gemstones increase the value of products, and thus it’s hard to assess the gold content of a shipment.
Tyler Durden
Fri, 12/23/2022 – 06:30
https://www.zerohedge.com/commodities/gold-trade-between-east-and-west-follows-90-year-old-pattern