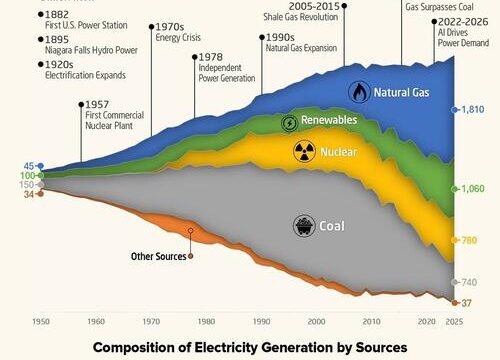
Visualizing 75 Years Of America’s Electricity Transition
Over the past 75 years, the U.S. electricity system has shifted from one dominated by coal to one in which natural gas and renewables supply nearly two-thirds of generation.
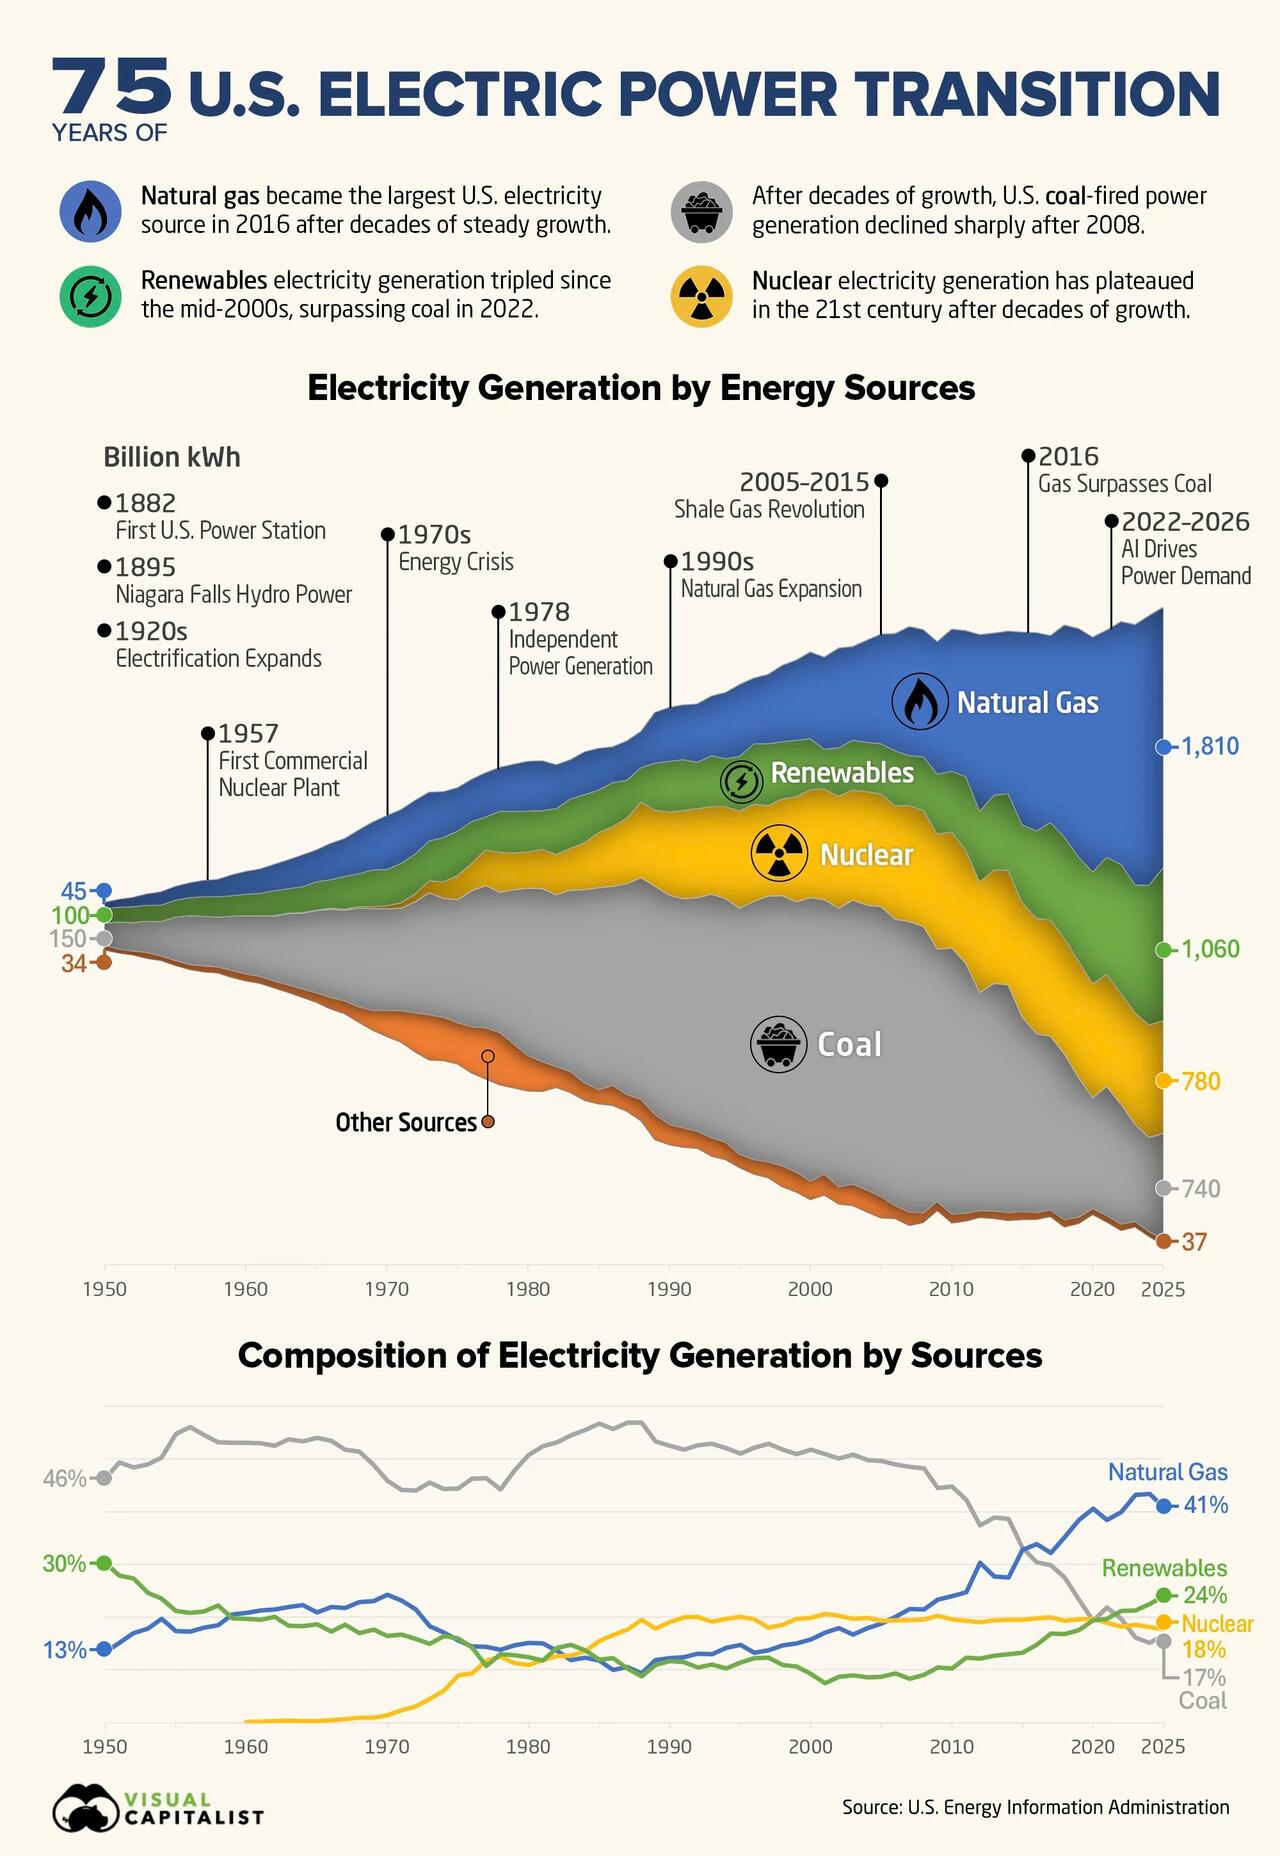
This visualization, via Visual Capitalist’s Niccolo Conte, shows annual U.S. electricity generation by source from 1950 to 2025 using data from the U.S. Energy Information Administration. It tracks output in billions of kilowatt-hours and each source’s share of the electricity mix over time.
Natural Gas and Renewables Lead U.S. Electricity Generation
Coal supplied 46.4% of U.S. electricity in 1950 and remained the country’s largest power source for decades. By 2025, however, its share had fallen to 16.6%. Natural gas moved in the opposite direction, rising from 13.5% to 40.8% and overtaking coal in 2016.
The table below shows each energy source’s share of total U.S. electricity generation at 15-year intervals from 1950 to 2025.
Energy Source
Share of U.S. Electricity Generation
1950
1965
1980
1995
2010
2025
Natural Gas
13.5%
21.0%
15.1%
14.8%
24.0%
40.8%
Renewables
30.2%
18.6%
12.4%
11.4%
10.2%
24.0%
Nuclear
0.0%
0.4%
11.0%
20.1%
19.6%
17.7%
Coal
46.4%
54.0%
50.7%
51.0%
44.8%
16.6%
Petroleum and Other
10.2%
6.1%
10.7%
2.8%
1.5%
0.8%
Renewables reached a 24.0% share in 2025 and have remained ahead of coal since 2022. Together, natural gas and renewables supplied 64.8% of U.S. electricity that year.
Coal peaked at 56.9% of the electricity mix in 1988. By 2025, no single source accounted for a majority of U.S. generation.
Coal Declined as U.S. Electricity Generation Surged
Coal generation peaked at 2,016 billion kWh in 2007. By 2025, it had fallen to 737 billion kWh, a decline of 63.4%.
Meanwhile, natural gas generation expanded rapidly with the growth of efficient combined-cycle power plants and abundant shale gas, rising from 45 billion kWh in 1950 to 1,807 billion kWh in 2025.
The table below shows U.S. electricity generation by source at 15-year intervals, measured in billions of kWh:
Energy Source
Electricity Generation (Billion kWh)
1950
1965
1980
1995
2010
2025
Natural Gas
45
222
346
496
988
1,807
Renewables
101
197
285
382
422
1,064
Nuclear
0
4
251
673
807
785
Coal
155
571
1,162
1,709
1,847
737
Petroleum and Other
34
65
246
93
61
37
Total Electricity Generation
334
1,058
2,290
3,353
4,125
4,430
Over the same period, total U.S. electricity generation rose from 334 billion kWh to 4,430 billion kWh. Natural gas accounted for about 43% of the overall increase, illustrating how it absorbed much of the system’s long-term growth.
The national shift is also visible at the regional level. A recent Visual Capitalist map of what powers each U.S. state and Canadian province shows natural gas as the leading electricity source across much of the United States.
Renewables Set a New Generation Record in 2025
Renewable generation rose to a record 1,064 billion kWh in 2025, equal to 24.0% of total electricity production. That was 93 billion kWh more than in 2024 and nearly twice the 539 billion kWh generated in 2015.
The complete dataset for U.S. electricity generation by source from 1950 to 2025 is available below:
Year
Natural Gas (Billion kWh)
Renewables (Billion kWh)
Nuclear (Billion kWh)
Coal (Billion kWh)
Petroleum and Other (Billion kWh)
Total Electricity Generation (Billion kWh)
1950
45
101
0
155
34
334
1951
57
105
0
185
29
375
1952
68
110
0
195
30
404
1953
80
110
0
219
38
447
1954
94
112
0
239
32
476
1955
95
117
0
301
37
550
1956
104
125
0
339
36
604
1957
114
134
0
346
40
635
1958
120
144
0
344
40
648
1959
147
141
0
378
47
713
1960
158
150
1
403
48
759
1961
169
156
2
422
49
797
1962
184
172
2
450
49
858
1963
202
169
3
494
52
920
1964
220
181
3
526
57
987
1965
222
197
4
571
65
1058
1966
251
198
6
613
79
1148
1967
265
226
8
630
89
1218
1968
304
227
13
685
104
1333
1969
333
254
14
706
138
1445
1970
373
252
22
704
184
1535
1971
374
270
38
713
220
1616
1972
376
278
54
771
274
1753
1973
341
278
83
848
314
1864
1974
320
307
114
828
301
1870
1975
300
307
173
853
289
1921
1976
295
291
191
944
320
2041
1977
306
228
251
985
358
2127
1978
305
287
276
976
365
2209
1979
329
287
255
1075
304
2251
1980
346
285
251
1162
246
2290
1981
346
270
273
1203
206
2298
1982
305
318
283
1192
147
2244
1983
274
342
294
1259
144
2313
1984
297
333
328
1342
120
2419
1985
292
295
384
1402
100
2473
1986
249
306
414
1386
137
2490
1987
273
265
455
1464
118
2575
1988
253
238
527
1541
149
2707
1989
353
325
529
1584
176
2967
1990
373
354
577
1594
140
3038
1991
382
353
613
1591
136
3074
1992
404
323
619
1621
117
3084
1993
415
353
610
1690
129
3197
1994
460
333
640
1691
123
3248
1995
496
382
673
1709
93
3353
1996
455
420
675
1795
99
3444
1997
479
430
629
1845
110
3492
1998
531
396
674
1874
146
3620
1999
556
393
728
1881
136
3695
2000
601
351
754
1966
130
3802
2001
639
279
769
1904
146
3737
2002
691
335
780
1933
120
3858
2003
650
347
764
1974
149
3883
2004
710
343
789
1978
151
3971
2005
761
351
782
2013
149
4055
2006
816
379
787
1991
91
4065
2007
897
346
806
2016
91
4157
2008
883
375
806
1986
70
4119
2009
921
413
799
1756
61
3950
2010
988
422
807
1847
61
4125
2011
1014
507
790
1733
56
4100
2012
1226
490
769
1514
49
4048
2013
1125
517
789
1581
54
4066
2014
1127
532
797
1582
56
4094
2015
1335
539
797
1352
55
4079
2016
1379
603
806
1239
51
4078
2017
1298
680
805
1206
47
4035
2018
1472
701
807
1149
52
4181
2019
1589
723
809
965
44
4131
2020
1627
778
790
773
42
4010
2021
1579
810
780
898
43
4110
2022
1687
895
772
832
46
4231
2023
1806
889
775
675
38
4183
2024
1870
971
782
652
34
4309
2025
1807
1064
785
737
37
4430
Renewables first edged above coal in 2020, fell back below it in 2021, and moved ahead again in 2022. They remained the larger source through 2025. Renewables also surpassed nuclear in 2021 and have stayed ahead since, while nuclear generation held relatively steady at about 785 billion kWh in 2025.
As U.S. electricity demand records its strongest three-year growth stretch since before the global financial crisis, natural gas and renewables are supplying much of the increase, including demand linked to AI data centers.
If you enjoyed today’s post, check out this map, What Powers Each U.S. State and Canadian Province?, on Voronoi.
Tyler Durden
Fri, 08/07/2026 – 18:50
https://www.zerohedge.com/energy/visualizing-75-years-americas-electricity-transition