
5 Stocks Account For 60% Of The S&P’s YTD Return: Charting The S&P 5 vs The S&P 495
Nvidia (NVDA) accounts for 34% of the 14% SPX year-to-date gain, and five stocks have accounted for 60% of the S&P 500 total YTD return; MSFT, NVDA, GOOGL, AMZN, and META have collectively surged by 45% and now comprise 25% of the S&P 500 equity cap.
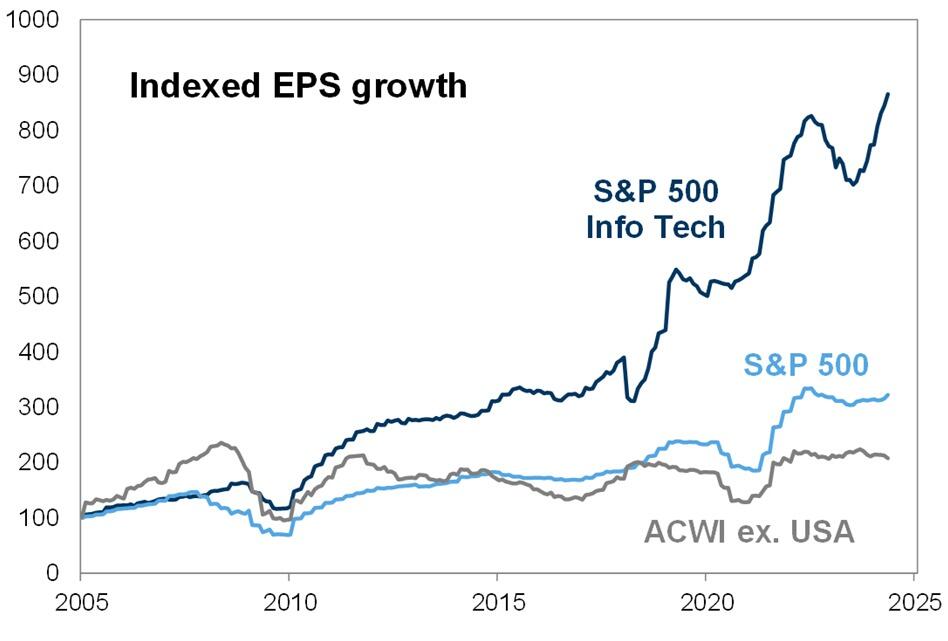
A key reason for this unprecedented outperformance is that these five companies posted Q1 EPS growth of 84% YoY vs 5% for the typical S&P 500 stock. Furthermore, strong results for the past four quarters have prompted analysts to raise their 2024 EPS forecasts by 38% for these five Tech stocks. In contrast, the profit forecast for the other 495 stocks in the index have been reduced by 5%.
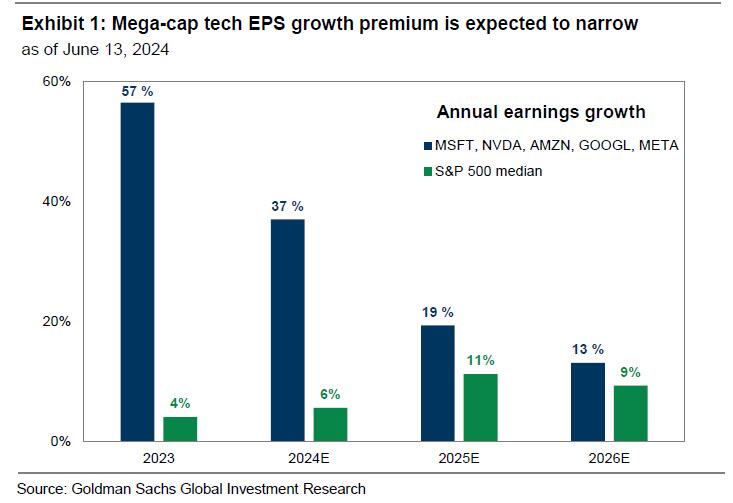
That said, while consensus 2024 forecasts imply a 31% gap between EPS growth for these five stocks and the median S&P 500 firm (37% vs. 6%) the gap is expected to narrow to 8% in 2025 and only 4% in 2026.
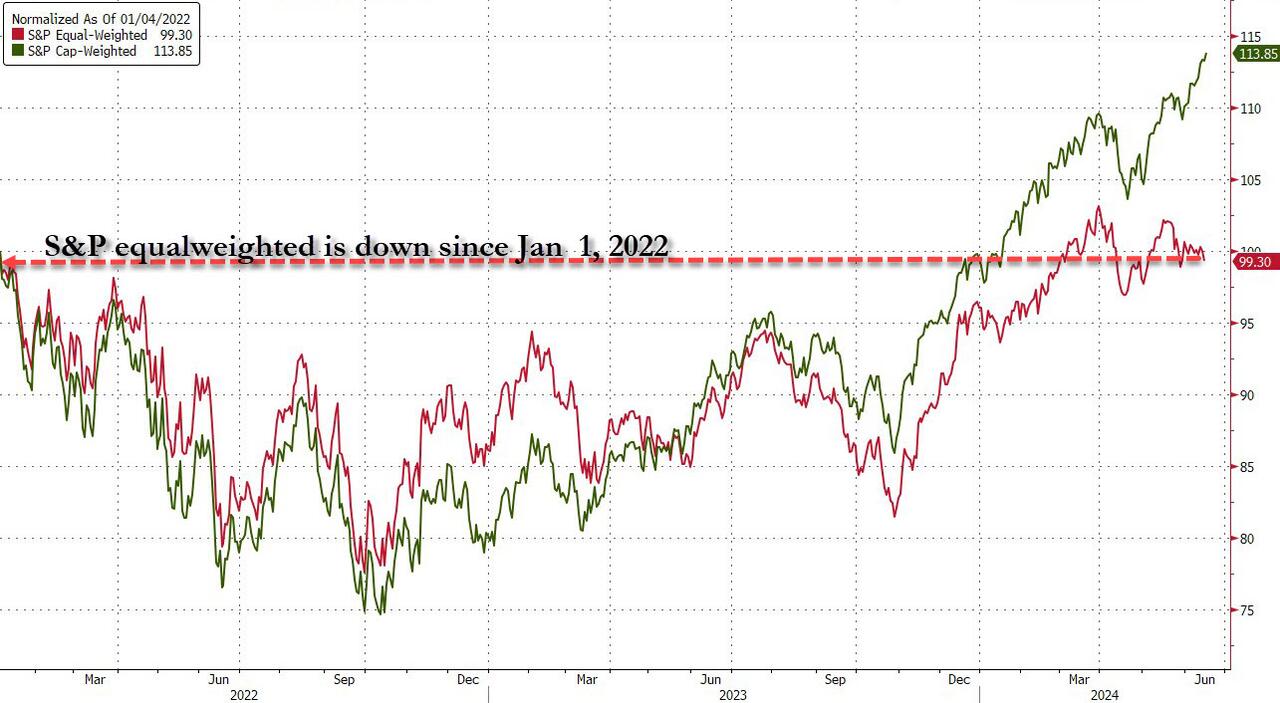
The performance gap between the SPX cap-weighted and equal-weight indices over the last two years is the widest in nearly 24 years. In fact, the equal-weighted index is now unchanged since the start of 2022.
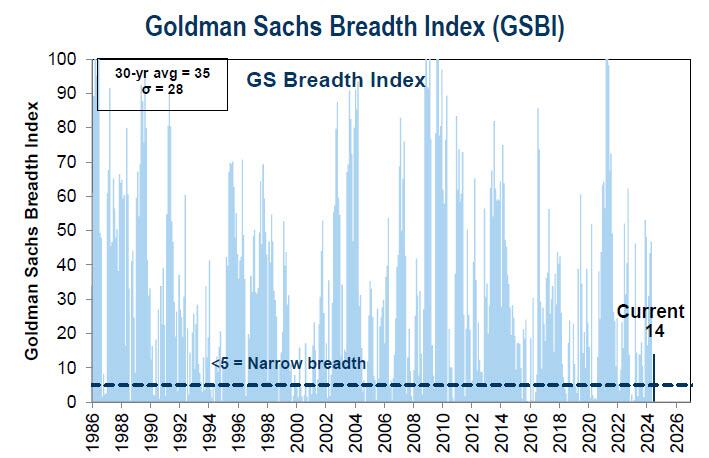
The consequences are clear: breadth is catastrophic, and according to Morgan Stanley, one month breadth just hit a new low, with the percentage of stocks outperforming the S&P reaching the lowest level on record.
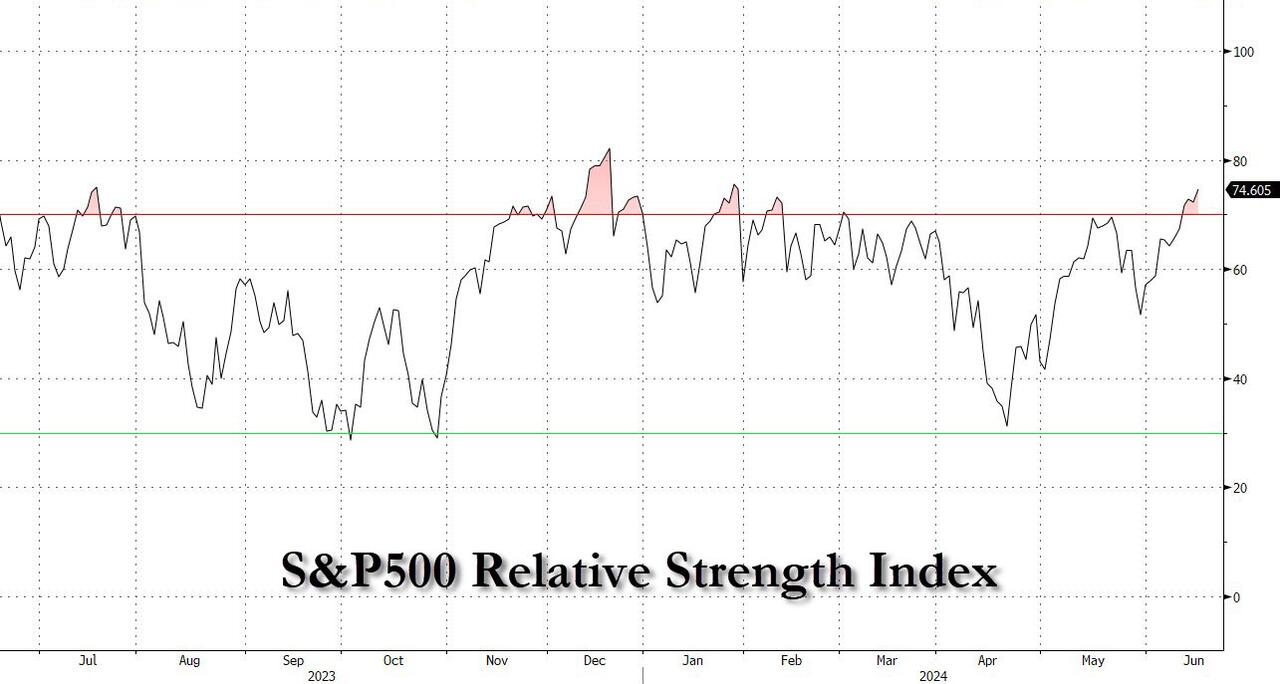
That has not stopped the cap-weighted SPX to officially be back in “overbought” territory with RSI at 75 but only 49% of S&P companies are above their 50dma.
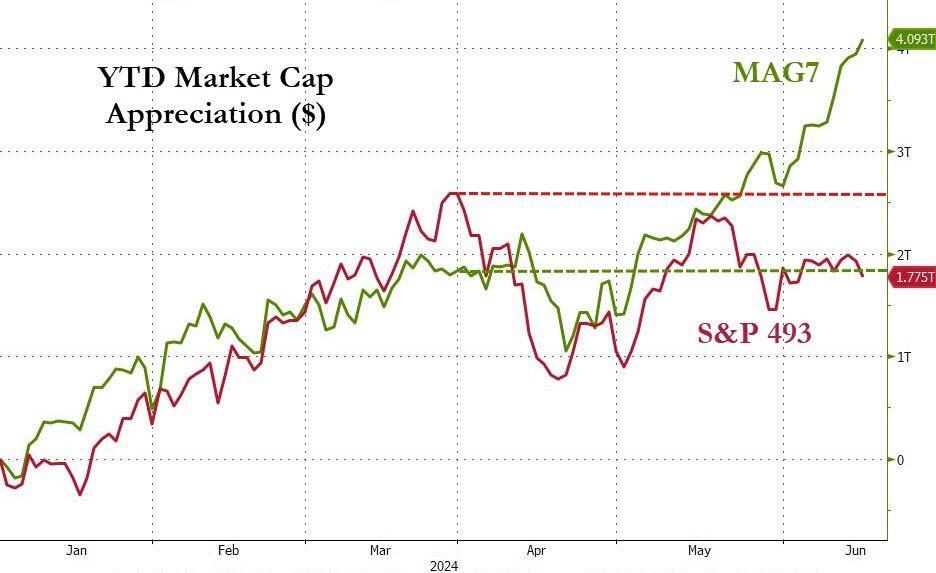
Within the broader S&P, the six mega-caps with $1+ trillion market caps are up an average of ~11.5% in Q2. The remaining 490+ stocks in the index are down an average of ~3% in Q2.
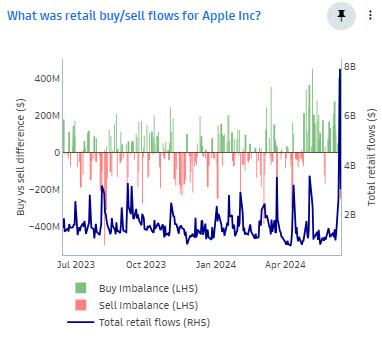
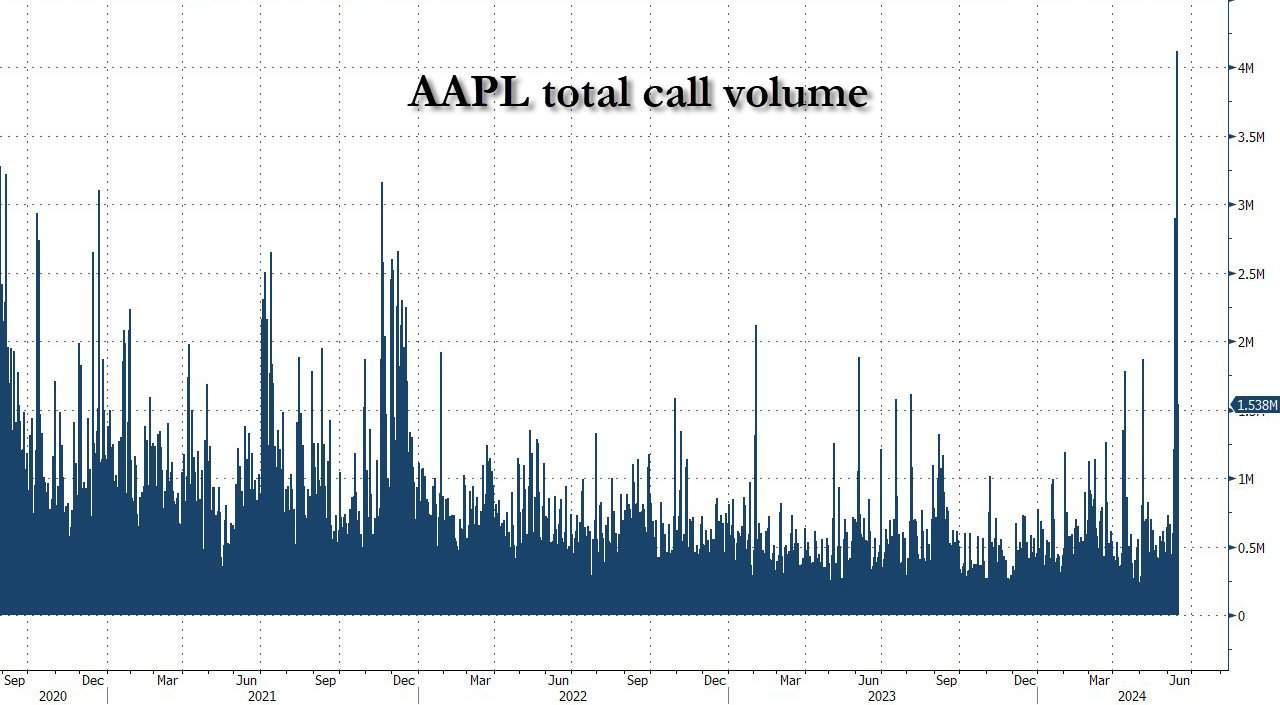
AAPL was up 8% last week, adding $260B in market cap this week alone after a flood of stock buybacks, a burst of retail buying…
… and a gamma squeeze, all of which combined to help the (formerly) world’s biggest company soar nearly 30% from its year-to-date lows as Tim Cook was hell-bent to reverse the narrative after dismal initial reception to the “Apple Intelligence” WWDC day.
Bloomberg’s John Authers asks:
‘Can this last’?
The question rings louder with every record the market breaks. Momentum tends to carry on for a long time until something stops it, but it’s very rare for such a rally to persist as long as this one.
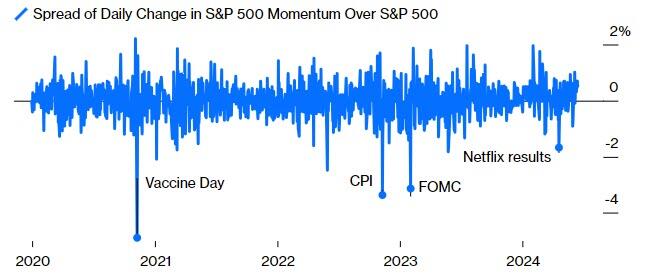
The one snag with momentum strategies is that when they reverse, they can do so in a very serious way. There hasn’t been a momentum crash for a while; the closest approach came when tech stocks sold off on April 19 after results from Netflix that were better than official forecasts but disappointed the market.
This was nothing compared to sharp moves in response to dovish signals from inflation data or from the Federal Reserve earlier in this cycle.
The biggest momentum reversal this decade came on the day in November 2020 when the results of Covid-19 vaccine tests convinced investors that the worst of the pandemic could be over much earlier than thought.
The reshuffle in the stock market was spectacular.
The Problem With Momentum – When it reverses, it can do so in a big way
Source: Bloomberg
With the same winners winning day after day, largely on growing enthusiasm rather than their results, it does make sense to fear a big reverse at some point, or indeed a bubble.
It’s perhaps even more concerning that the force driving the winners on is mostly valuations; it’s not about any great momentum in growing earnings, even though several companies have very much shown it.
The S&P 500 Momentum index’s earnings multiple tripled after plumbing its lowest point in over a decade only last May.
Over that period, its multiple growth has far outstripped that of the Magnificent Seven — although it’s obvious that the AI craze has a stake in this:
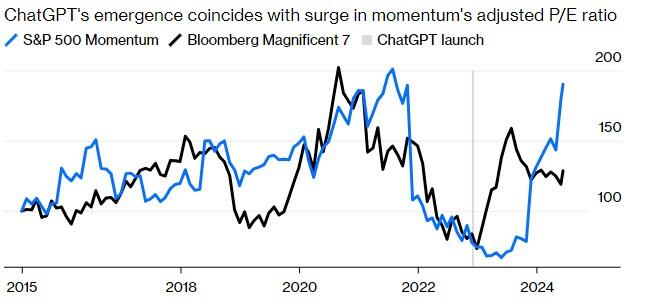
Source: Bloomberg
As one veteran trader remarked (while we note he admits participating tactically in this farce):
“This won’t end well…”
Tyler Durden
Mon, 06/17/2024 – 15:05
https://www.zerohedge.com/markets/5-stocks-account-60-sps-return-charting-sp-5-vs-sp-495