How Economic Power Has Shifted Over The Past 200 Years
Over the last 200 years, economic leadership has shifted from China to the British Empire, then to the United States, and increasingly back toward Asia.
This streamgraph, via Visual Capitalist’s Gabriel Cohen, tracks how the share of global gross domestic product (GDP) held by major economies changed from 1820 to 2025. The visualization incorporates the latest available data from the Maddison Project Database, the COLDAT Colonial Dates Dataset, and the IMF’s World Economic Outlook.
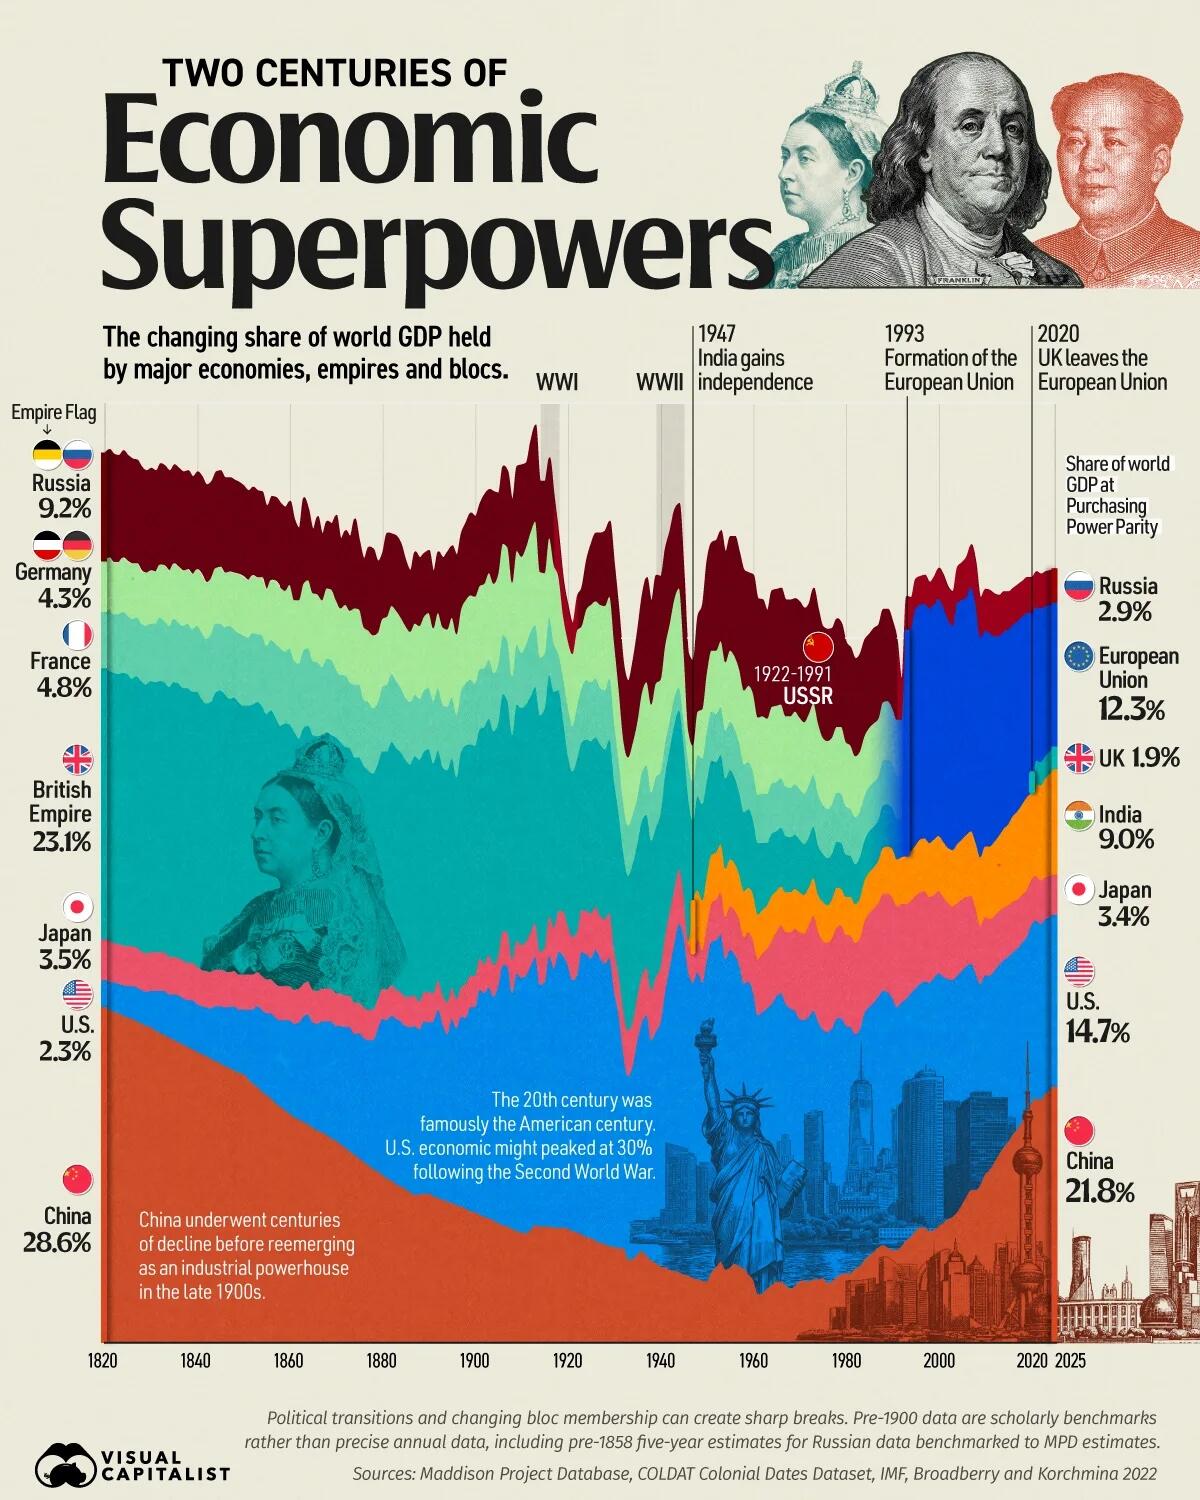
All GDP figures are adjusted for purchasing power parity (PPP), accounting for differences in living costs and production across countries.
The table below shows how each economy’s share of world GDP changed across two centuries:
Economy
Share of World GDP (%)
1820
1855
1890
1925
1960
1995
2025
🇨🇳 China
28.6%
21.1%
12.7%
8.9%
5.3%
9.5%
21.8%
🇺🇸 U.S.
2.3%
7.0%
14.6%
23.9%
24.5%
20.7%
14.7%
🇪🇺 EU
—
—
—
—
—
17.0%
12.3%
🇮🇳 India
—
—
—
—
3.9%
4.3%
9.0%
🇯🇵 Japan
3.5%
2.9%
2.6%
3.8%
4.5%
7.9%
3.4%
🇷🇺 Russia / USSR
9.2%
7.1%
5.3%
5.2%
10.1%
2.5%
2.9%
🇬🇧 British Empire / Britain
23.1%
22.6%
20.7%
14.7%
6.3%
3.2%
1.9%
🇫🇷 France
4.8%
5.8%
5.2%
5.0%
4.1%
—
—
🇩🇪 Germany
4.3%
4.8%
6.4%
6.6%
6.7%
—
—
Pax Britannica and the European Years
Britain was the first country in the world to industrialize. As a result, the British Empire became the world’s preeminent superpower during the 19th century, an era sometimes known as Pax Britannica because of the relative absence of conflict between the major powers.
In 1845, the British Empire, on which the sun famously “never set,” contributed nearly one-quarter (23.8%) of global GDP. India was the empire’s most economically significant possession before gaining independence in 1947.
The table below shows each economy’s peak share of world GDP, the year it reached that level, and its share in 2025:
Economy
Peak Share (%)
Peak Year
2025 Share (%)
🇺🇸 U.S.
29.7%
1944
14.7%
🇨🇳 China
28.6%
1820
21.8%
🇬🇧 British Empire / Britain
23.8%
1845
1.9%
🇪🇺 EU
17.9%
2007
12.3%
🇷🇺 Russia / USSR
10.2%
1956
2.9%
🇮🇳 India
9.0%
2025
9.0%
🇩🇪 Germany
8.8%
1913
🇯🇵 Japan
8.6%
1990
3.4%
🇫🇷 France
6.6%
1858
The rest of Europe’s fortunes followed a similar trajectory. The French Empire reached its peak share in 1858, at 6.6%, while Germany peaked at 8.8% in 1913, on the eve of the First World War.
Following decades of war and declining influence on the world stage, several European economies joined together in the European Union. The bloc contributed 17.9% of global GDP in 2007, ahead of the global financial crisis, though its share later declined and was further reduced by the UK’s withdrawal in 2020.
The Fall of Empire and the Rise of the U.S.
If the 19th century was the British century, the 20th was the American century. Like Britain before it, the U.S. became the world’s largest exporter for a time.
World War II marked a turning point in global economic leadership. By 1944, the U.S. accounted for 29.7% of world GDP, the highest share reached by any economy in the modern period covered by this dataset.
American economic dominance was supported by high-value industries and the country’s central role in global finance, manufacturing, and trade.
The U.S. also continues to dominate rankings of the world’s largest and most profitable companies today. It also is still the undisputed economic powerhouse in nominal GDP terms.
The Asian Century
For centuries, China was a center of the global economy. Political instability and its failure to keep pace with European industrialization contributed to a long decline in its share of world GDP during the 19th and 20th centuries.
Beginning in the late 20th century, economic reforms and China’s emergence as a global manufacturing hub helped it regain lost ground. By 2025, China accounted for 21.8% of world GDP, or more than one-fifth of the total.
The full dataset below shows each economy’s share of world GDP for every year from 1820 to 2025:
Year
Share of World GDP (%)
🇨🇳 China
🇺🇸 U.S.
🇪🇺 EU
🇮🇳 India
🇯🇵 Japan
🇷🇺 Russia / USSR
🇬🇧 British Empire / Britain
🇫🇷 France
🇩🇪 Germany
1820
28.6%
2.3%
—
—
3.5%
9.2%
23.1%
4.8%
4.3%
1821
28.4%
2.4%
—
—
3.5%
9.2%
23.0%
5.2%
4.4%
1822
28.2%
2.5%
—
—
3.4%
9.2%
23.0%
5.0%
4.4%
1823
28.1%
2.5%
—
—
3.4%
9.2%
23.0%
5.1%
4.4%
1824
27.9%
2.6%
—
—
3.4%
9.2%
23.2%
5.2%
4.6%
1825
27.7%
2.7%
—
—
3.4%
9%
23.2%
5.0%
4.6%
1826
27.6%
2.8%
—
—
3.4%
9%
22.8%
5.1%
4.7%
1827
27.4%
2.9%
—
—
3.4%
9%
23.1%
5.0%
4.6%
1828
27.2%
2.9%
—
—
3.3%
9%
23.0%
4.9%
4.5%
1829
27.0%
2.9%
—
—
3.3%
9%
22.9%
5.0%
4.5%
1830
26.9%
3.1%
—
—
3.3%
8.7%
23.1%
4.9%
4.5%
1831
26.6%
3.4%
—
—
3.3%
8.7%
23.0%
5.0%
4.4%
1832
26.4%
3.6%
—
—
3.3%
8.7%
23.1%
5.4%
4.5%
1833
26.2%
3.8%
—
—
3.3%
8.7%
23.0%
5.2%
4.7%
1834
26.0%
3.7%
—
—
3.2%
8.7%
23.0%
5.2%
4.7%
1835
25.8%
3.9%
—
—
3.2%
8.4%
23.4%
5.4%
4.7%
1836
25.6%
4.0%
—
—
3.2%
8.4%
23.4%
5.2%
4.7%
1837
25.4%
4.0%
—
—
3.2%
8.4%
23.2%
5.3%
4.7%
1838
25.2%
4.0%
—
—
3.2%
8.4%
23.4%
5.5%
4.6%
1839
25.0%
4.2%
—
—
3.2%
8.4%
23.1%
5.3%
4.7%
1840
24.8%
4.1%
—
—
3.2%
8.3%
23.4%
5.6%
4.8%
1841
24.6%
4.1%
—
—
3.1%
8.3%
23.1%
5.7%
4.9%
1842
24.4%
4.2%
—
—
3.1%
8.3%
22.8%
5.5%
4.8%
1843
24.2%
4.3%
—
—
3.1%
8.3%
23.0%
5.8%
4.7%
1844
24.0%
4.7%
—
—
3.1%
8.3%
23.6%
5.9%
4.7%
1845
23.8%
4.9%
—
—
3.1%
8.2%
23.8%
5.7%
4.8%
1846
23.6%
5.0%
—
—
3.1%
8.2%
23.6%
5.7%
4.6%
1847
23.4%
5.2%
—
—
3.0%
8.2%
23.3%
6.2%
4.6%
1848
23.2%
5.5%
—
—
3.0%
8.2%
23.3%
5.8%
4.8%
1849
23.0%
5.4%
—
—
3.0%
8.2%
23.2%
5.9%
5.0%
1850
22.9%
5.5%
—
—
3.0%
7.7%
22.9%
6.0%
5.0%
1851
22.5%
5.9%
—
—
3.0%
7.7%
22.9%
5.8%
4.9%
1852
22.1%
6.3%
—
—
3.0%
7.7%
23.0%
6.1%
4.9%
1853
21.8%
6.9%
—
—
2.9%
7.7%
23.0%
5.8%
4.8%
1854
21.4%
7.0%
—
—
2.9%
7.7%
23.0%
6.0%
4.9%
1855
21.1%
7.0%
—
—
2.9%
7.1%
22.6%
5.8%
4.8%
1856
20.8%
7.3%
—
—
2.9%
7.1%
22.9%
6.0%
5.1%
1857
20.4%
7.3%
—
—
2.9%
7.1%
22.7%
6.3%
5.3%
1858
20.1%
7.4%
—
—
2.9%
7.1%
22.2%
6.6%
5.2%
1859
19.8%
7.7%
—
—
2.9%
7.1%
22.4%
6.1%
5.2%
1860
19.5%
8.0%
—
—
2.9%
7.1%
22.3%
6.5%
5.4%
1861
19.2%
8.0%
—
—
2.9%
6.8%
22.0%
6.0%
5.2%
1862
19.0%
8.3%
—
—
2.9%
6.1%
21.3%
6.4%
5.4%
1863
18.8%
9.0%
—
—
2.8%
7.3%
21.8%
6.6%
5.7%
1864
18.6%
9.4%
—
—
2.8%
6.0%
21.8%
6.6%
5.8%
1865
18.3%
9.0%
—
—
2.8%
5.4%
21.7%
6.3%
5.8%
1866
18.1%
9.1%
—
—
2.8%
6.6%
21.7%
6.3%
5.8%
1867
17.9%
9.5%
—
—
2.8%
5.6%
21.6%
5.8%
5.7%
1868
17.7%
9.7%
—
—
2.8%
5.7%
21.8%
6.3%
6.0%
1869
17.4%
10.0%
—
—
2.8%
5.6%
21.6%
6.4%
6.0%
1870
17.2%
9.8%
—
—
2.8%
7.2%
21.8%
5.8%
5.9%
1871
16.9%
10.1%
—
—
2.8%
5.9%
21.4%
5.7%
5.7%
1872
16.6%
10.3%
—
—
2.7%
6.3%
21.2%
6.1%
6.0%
1873
16.3%
10.6%
—
—
2.7%
6.3%
21.1%
5.6%
6.1%
1874
16.0%
10.3%
—
—
2.7%
7.6%
20.9%
6.2%
6.5%
1875
15.7%
10.7%
—
—
2.6%
5.8%
20.9%
6.2%
6.4%
1876
15.4%
10.6%
—
—
2.6%
5.8%
20.6%
5.6%
6.2%
1877
15.1%
10.7%
—
—
2.6%
7.1%
20.4%
5.8%
6.1%
1878
14.8%
11.0%
—
—
2.6%
7.3%
20.1%
5.6%
6.2%
1879
14.6%
12.1%
—
—
2.6%
6.1%
20.0%
5.2%
6.0%
1880
14.3%
13.3%
—
—
2.6%
5.6%
20.2%
5.5%
5.8%
1881
14.0%
13.5%
—
—
2.6%
7.1%
20.3%
5.7%
5.8%
1882
13.8%
14.1%
—
—
2.6%
6.1%
20.7%
5.8%
5.8%
1883
13.5%
14.1%
—
—
2.5%
6.3%
20.6%
5.7%
6.0%
1884
13.3%
14.1%
—
—
2.5%
6.2%
20.4%
5.5%
6.0%
1885
13.1%
13.9%
—
—
2.5%
5.5%
20.2%
5.3%
6.1%
1886
12.8%
14.1%
—
—
2.6%
5.2%
19.8%
5.3%
6.0%
1887
12.6%
14.4%
—
—
2.6%
6.1%
20.4%
5.2%
6.1%
1888
12.6%
14.1%
—
—
2.4%
5.8%
20.6%
5.2%
6.2%
1889
12.7%
14.7%
—
—
2.5%
5.4%
20.5%
5.2%
6.3%
1890
12.7%
14.6%
—
—
2.6%
5.3%
20.7%
5.2%
6.4%
1891
12.5%
14.9%
—
—
2.4%
4.8%
19.6%
5.3%
6.2%
1892
12.3%
16.1%
—
—
2.5%
5.2%
19.6%
5.3%
6.4%
1893
12.2%
15.0%
—
—
2.5%
5.9%
19.4%
5.3%
6.6%
1894
12.0%
14.3%
—
—
2.7%
6.6%
19.8%
5.4%
6.6%
1895
11.9%
15.7%
—
—
2.7%
6.1%
19.5%
5.2%
6.8%
1896
11.7%
15.1%
—
—
2.5%
6.7%
18.9%
5.3%
6.9%
1897
11.6%
16.2%
—
—
2.5%
6.5%
20.1%
5.1%
7.0%
1898
11.4%
16.3%
—
—
2.9%
6.6%
20.3%
5.3%
7.1%
1899
11.2%
17.4%
—
—
2.7%
7.0%
19.7%
5.5%
7.2%
1900
11.1%
17.5%
—
—
2.7%
6.8%
19.6%
5.3%
7.4%
1901
10.9%
19.2%
—
—
2.7%
7.0%
19.5%
5.1%
7.1%
1902
10.7%
19.1%
—
—
2.5%
7.6%
20.2%
5.0%
7.2%
1903
10.6%
19.7%
—
—
2.8%
7.1%
20.1%
5.0%
7.4%
1904
10.4%
19.1%
—
—
2.7%
7.8%
19.9%
5.0%
7.6%
1905
10.2%
20.2%
—
—
2.6%
6.9%
19.8%
5.0%
7.7%
1906
10.0%
22.2%
—
—
2.9%
6.6%
20.2%
5.0%
7.8%
1907
9.9%
22.2%
—
—
2.9%
6.4%
19.7%
5.1%
8.0%
1908
9.7%
20.1%
—
—
2.9%
7.0%
19.1%
5.0%
8.0%
1909
9.5%
22.0%
—
—
2.8%
7.2%
20.1%
5.1%
8.0%
1910
9.4%
21.7%
—
—
2.8%
7.8%
20.2%
4.7%
8.2%
1911
9.3%
22.0%
—
—
2.9%
7.2%
20.2%
5.1%
8.3%
1912
9.6%
22.5%
—
—
2.9%
7.8%
20.1%
5.5%
8.5%
1913
10.0%
22.9%
—
—
2.9%
8.2%
20.1%
5.3%
8.8%
1914
9.9%
20.6%
—
—
2.8%
7.7%
20.2%
4.9%
7.3%
1915
9.9%
20.8%
—
—
3.0%
7.8%
20.3%
4.7%
6.9%
1916
9.9%
23.1%
—
—
3.4%
6.8%
20.5%
4.9%
6.8%
1917
9.8%
22.1%
—
—
3.5%
5.8%
20.1%
4.1%
6.7%
1918
9.8%
23.5%
—
—
3.5%
3.5%
18.8%
3.1%
6.6%
1919
9.8%
23.2%
—
—
3.8%
3.0%
16.3%
3.6%
5.3%
1920
9.7%
22.5%
—
—
3.4%
2.9%
14.5%
4.2%
5.6%
1921
9.5%
21.4%
—
—
3.7%
2.6%
14.1%
3.9%
6.1%
1922
9.4%
21.9%
—
—
3.7%
2.9%
14.7%
4.5%
6.5%
1923
9.2%
24.1%
—
—
3.6%
3.3%
14.3%
4.6%
5.3%
1924
9.0%
24.1%
—
—
3.7%
4.2%
14.6%
5.1%
6.0%
1925
8.9%
23.9%
—
—
3.8%
5.2%
14.7%
5.0%
6.6%
1926
8.7%
24.8%
—
—
3.7%
5.8%
14.4%
5.0%
6.6%
1927
8.5%
24.3%
—
—
3.6%
6.1%
14.6%
4.8%
7.1%
1928
8.4%
23.9%
—
—
3.8%
6.4%
14.5%
5.0%
7.2%
1929
8.2%
24.6%
—
—
3.9%
6.4%
14.7%
5.2%
7.0%
1930
8.2%
21.8%
—
—
3.5%
6.6%
14.4%
5.0%
6.8%
1931
8.0%
19.9%
—
—
3.5%
6.6%
13.7%
4.5%
6.1%
1932
8.1%
16.5%
—
—
3.7%
6.4%
13.4%
4.2%
5.5%
1933
7.1%
15.6%
—
—
3.9%
6.5%
13.2%
4.3%
5.8%
1934
7.1%
16.5%
—
—
3.8%
7.0%
13.4%
4.2%
6.1%
1935
7.5%
18.2%
—
—
3.9%
7.8%
12.9%
4.0%
6.4%
1936
7.8%
19.5%
—
—
4.0%
8.3%
13.2%
4.1%
6.8%
1937
7.4%
20.5%
—
—
4.1%
8.9%
13.0%
4.2%
7.1%
1938
7.0%
18.8%
—
—
4.2%
8.8%
12.8%
4.1%
7.5%
1939
6.8%
19.7%
—
—
4.7%
9.2%
12.7%
4.3%
8.0%
1940
6.5%
20.8%
—
—
4.7%
8.8%
13.1%
3.5%
7.9%
1941
6.4%
23.5%
—
—
4.8%
8.3%
13.7%
2.7%
8.3%
1942
6.2%
25.8%
—
—
4.8%
7.9%
13.8%
2.4%
8.3%
1943
6.1%
27.9%
—
—
4.7%
7.6%
14.0%
2.3%
8.4%
1944
6.0%
29.7%
—
—
4.7%
7.2%
13.5%
1.9%
8.5%
1945
5.8%
28.8%
—
—
3.5%
6.8%
12.9%
2.0%
6.0%
1946
5.7%
25.9%
—
—
2.6%
6.5%
12.2%
3.0%
2.8%
1947
5.5%
25.2%
—
4.2%
2.6%
7.2%
7.0%
3.3%
3.1%
1948
5.4%
26.2%
—
4.2%
2.8%
8.1%
8.0%
3.5%
3.7%
1949
5.3%
25.4%
—
4.2%
2.8%
8.9%
8.2%
3.9%
4.2%
1950
5.2%
27.4%
—
4.2%
3.0%
9.6%
8.1%
4.2%
5.0%
1951
6.0%
28.2%
—
4.1%
3.3%
9.2%
8.0%
4.2%
5.2%
1952
6.4%
27.9%
—
4.0%
3.5%
9.4%
7.7%
4.1%
5.4%
1953
6.9%
27.9%
—
4.1%
3.6%
9.4%
7.6%
4.1%
5.6%
1954
6.2%
26.5%
—
4.1%
3.6%
9.4%
7.7%
4.1%
5.8%
1955
6.4%
27.1%
—
4.0%
3.7%
9.7%
7.6%
4.1%
6.1%
1956
6.7%
26.4%
—
4.0%
3.8%
10.2%
7.3%
4.1%
6.2%
1957
6.5%
25.7%
—
3.8%
3.9%
9.9%
7.0%
4.2%
6.3%
1958
6.3%
24.3%
—
3.9%
4.0%
10.2%
6.7%
4.1%
6.3%
1959
5.8%
25.0%
—
3.8%
4.2%
9.6%
6.7%
4.0%
6.5%
1960
5.3%
24.5%
—
3.9%
4.5%
10.1%
6.3%
4.1%
6.7%
1961
4.1%
23.8%
—
3.8%
4.8%
10.1%
6.1%
4.1%
6.6%
1962
4.2%
24.0%
—
3.7%
5.0%
9.9%
5.7%
4.2%
6.6%
1963
4.6%
23.9%
—
3.7%
5.1%
9.2%
5.3%
4.2%
6.4%
1964
4.9%
24.0%
—
3.8%
5.4%
9.9%
5.3%
4.3%
6.5%
1965
5.2%
24.3%
—
3.5%
5.5%
9.9%
5.1%
4.2%
6.5%
1966
5.2%
24.6%
—
3.3%
5.8%
9.9%
5.0%
4.2%
6.3%
1967
4.9%
24.0%
—
3.4%
6.1%
9.9%
4.8%
4.2%
6.0%
1968
4.6%
23.9%
—
3.4%
6.5%
9.9%
4.7%
4.2%
6.1%
1969
4.8%
23.5%
—
3.4%
7.0%
9.6%
4.6%
4.3%
6.2%
1970
5.2%
22.4%
—
3.4%
7.4%
9.8%
4.5%
4.3%
6.1%
1971
5.3%
22.2%
—
3.3%
7.4%
9.7%
4.3%
4.3%
6.1%
1972
5.2%
22.6%
—
3.2%
7.8%
9.4%
4.3%
4.4%
6.1%
1973
5.4%
22.9%
—
3.2%
8.1%
9.8%
4.4%
4.4%
6.1%
1974
5.4%
22.0%
—
3.1%
7.7%
9.7%
4.2%
4.4%
6.0%
1975
5.5%
21.2%
—
3.3%
7.6%
9.4%
4.1%
4.2%
5.7%
1976
5.1%
21.4%
—
3.2%
7.6%
9.5%
4.0%
4.2%
5.8%
1977
5.2%
21.6%
—
3.3%
7.7%
9.3%
3.9%
4.2%
5.7%
1978
5.6%
22.0%
—
3.4%
7.8%
9.2%
3.9%
4.2%
5.6%
1979
5.8%
21.9%
—
3.1%
7.9%
8.8%
3.9%
4.2%
5.7%
1980
5.9%
21.1%
—
3.2%
7.8%
8.5%
3.6%
4.1%
5.5%
1981
5.9%
21.0%
—
3.3%
7.8%
8.3%
3.5%
4.0%
5.4%
1982
6.3%
20.0%
—
3.3%
7.8%
8.3%
3.4%
4.0%
5.2%
1983
6.5%
20.2%
—
3.4%
7.8%
8.3%
3.5%
3.9%
5.1%
1984
7.0%
21.1%
—
3.5%
7.8%
8.2%
3.4%
3.8%
5.1%
1985
7.4%
21.2%
—
3.5%
8.0%
8.0%
3.5%
3.8%
5.0%
1986
7.7%
21.3%
—
3.5%
8.0%
8.1%
3.5%
3.8%
5.0%
1987
8.1%
21.4%
—
3.6%
8.0%
8.0%
3.5%
3.7%
4.9%
1988
8.3%
21.7%
—
3.9%
8.3%
7.9%
3.6%
3.8%
5.0%
1989
8.1%
21.8%
—
4.0%
8.4%
7.8%
3.6%
3.8%
5.0%
1990
7.9%
21.5%
—
4.1%
8.6%
7.4%
3.5%
3.8%
4.7%
1991
7.9%
20.7%
—
4.0%
8.6%
6.8%
3.4%
3.7%
4.8%
1992
8.2%
20.8%
—
4.0%
8.4%
3.4%
3.2%
3.7%
4.8%
1993
8.7%
20.6%
15.8%
4.1%
8.1%
3.1%
3.2%
—
—
1994
9.0%
20.8%
15.8%
4.2%
7.9%
2.6%
3.2%
—
—
1995
9.5%
20.7%
17.0%
4.3%
7.9%
2.5%
3.2%
—
—
1996
9.8%
20.8%
16.8%
4.5%
7.8%
2.4%
3.2%
—
—
1997
9.8%
21.0%
16.8%
4.5%
7.7%
2.4%
3.2%
—
—
1998
9.5%
21.2%
16.9%
4.6%
7.3%
2.2%
3.1%
—
—
1999
9.6%
21.5%
16.9%
4.7%
7.1%
2.4%
3.1%
—
—
2000
9.9%
21.6%
17.1%
4.7%
7.0%
2.6%
3.1%
—
—
2001
10.2%
21.0%
16.9%
4.7%
6.8%
2.7%
3.1%
—
—
2002
10.5%
20.5%
16.5%
4.7%
6.5%
2.7%
3.0%
—
—
2003
10.7%
20.2%
16.1%
4.8%
6.3%
2.9%
3.0%
—
—
2004
11.1%
20.2%
17.6%
5.0%
6.2%
3.0%
3.0%
—
—
2005
11.7%
20.0%
17.4%
5.1%
6.1%
3.2%
3.0%
—
—
2006
12.4%
19.7%
17.4%
5.3%
5.9%
3.4%
2.9%
—
—
2007
13.0%
19.3%
17.9%
5.5%
5.8%
3.6%
2.9%
—
—
2008
13.0%
18.5%
17.5%
5.6%
5.5%
3.7%
2.7%
—
—
2009
13.4%
17.2%
16.2%
5.8%
5.0%
3.4%
2.5%
—
—
2010
14.3%
17.0%
16.0%
6.0%
5.0%
3.5%
2.4%
—
—
2011
14.7%
16.6%
15.8%
6.2%
4.8%
3.6%
2.4%
—
—
2012
15.3%
16.4%
15.2%
6.3%
4.7%
3.6%
2.3%
—
—
2013
16.0%
16.2%
14.7%
6.4%
4.6%
3.5%
2.3%
—
—
2014
16.6%
16.0%
14.5%
6.7%
4.5%
3.4%
2.3%
—
—
2015
17.1%
15.8%
14.3%
6.9%
4.4%
3.2%
2.3%
—
—
2016
17.7%
15.6%
14.1%
7.3%
4.3%
3.1%
2.2%
—
—
2017
18.2%
15.4%
14.0%
7.5%
4.2%
3.1%
2.2%
—
—
2018
18.8%
15.3%
13.8%
7.7%
4.1%
3.0%
2.2%
—
—
2019
19.4%
15.2%
13.6%
7.9%
4.0%
3.0%
2.1%
—
—
2020
20.4%
15.2%
13.2%
7.5%
3.9%
3.0%
2.0%
—
—
2021
20.8%
15.2%
13.1%
7.8%
3.8%
3.0%
2.0%
—
—
2022
20.7%
15.0%
13.1%
8.1%
3.7%
2.9%
2.0%
—
—
2023
21.2%
14.9%
12.8%
8.4%
3.6%
2.9%
1.9%
—
—
2024
21.5%
14.8%
12.5%
8.7%
3.5%
2.9%
1.9%
—
—
2025
21.8%
14.7%
12.3%
9.0%
3.4%
2.9%
1.9%
—
—
Together, China and India accounted for 30.8% of global GDP in 2025. Their large populations and lower production costs give both countries greater weight when output is measured using purchasing power parity.
Whether this shift continues will depend partly on how China addresses demographic pressures similar to those facing Japan and the European Union, as well as broader challenges related to productivity and economic growth.
To see how the world’s major Western industrialized economies are losing GDP share, read The G7’s Share of Global GDP is Shrinking on Voronoi, the new app from Visual Capitalist.
Tyler Durden
Wed, 08/05/2026 – 04:15
https://www.zerohedge.com/geopolitical/how-economic-power-has-shifted-over-past-200-years