New Mexico Is The State Most Dependent On Food Stamps
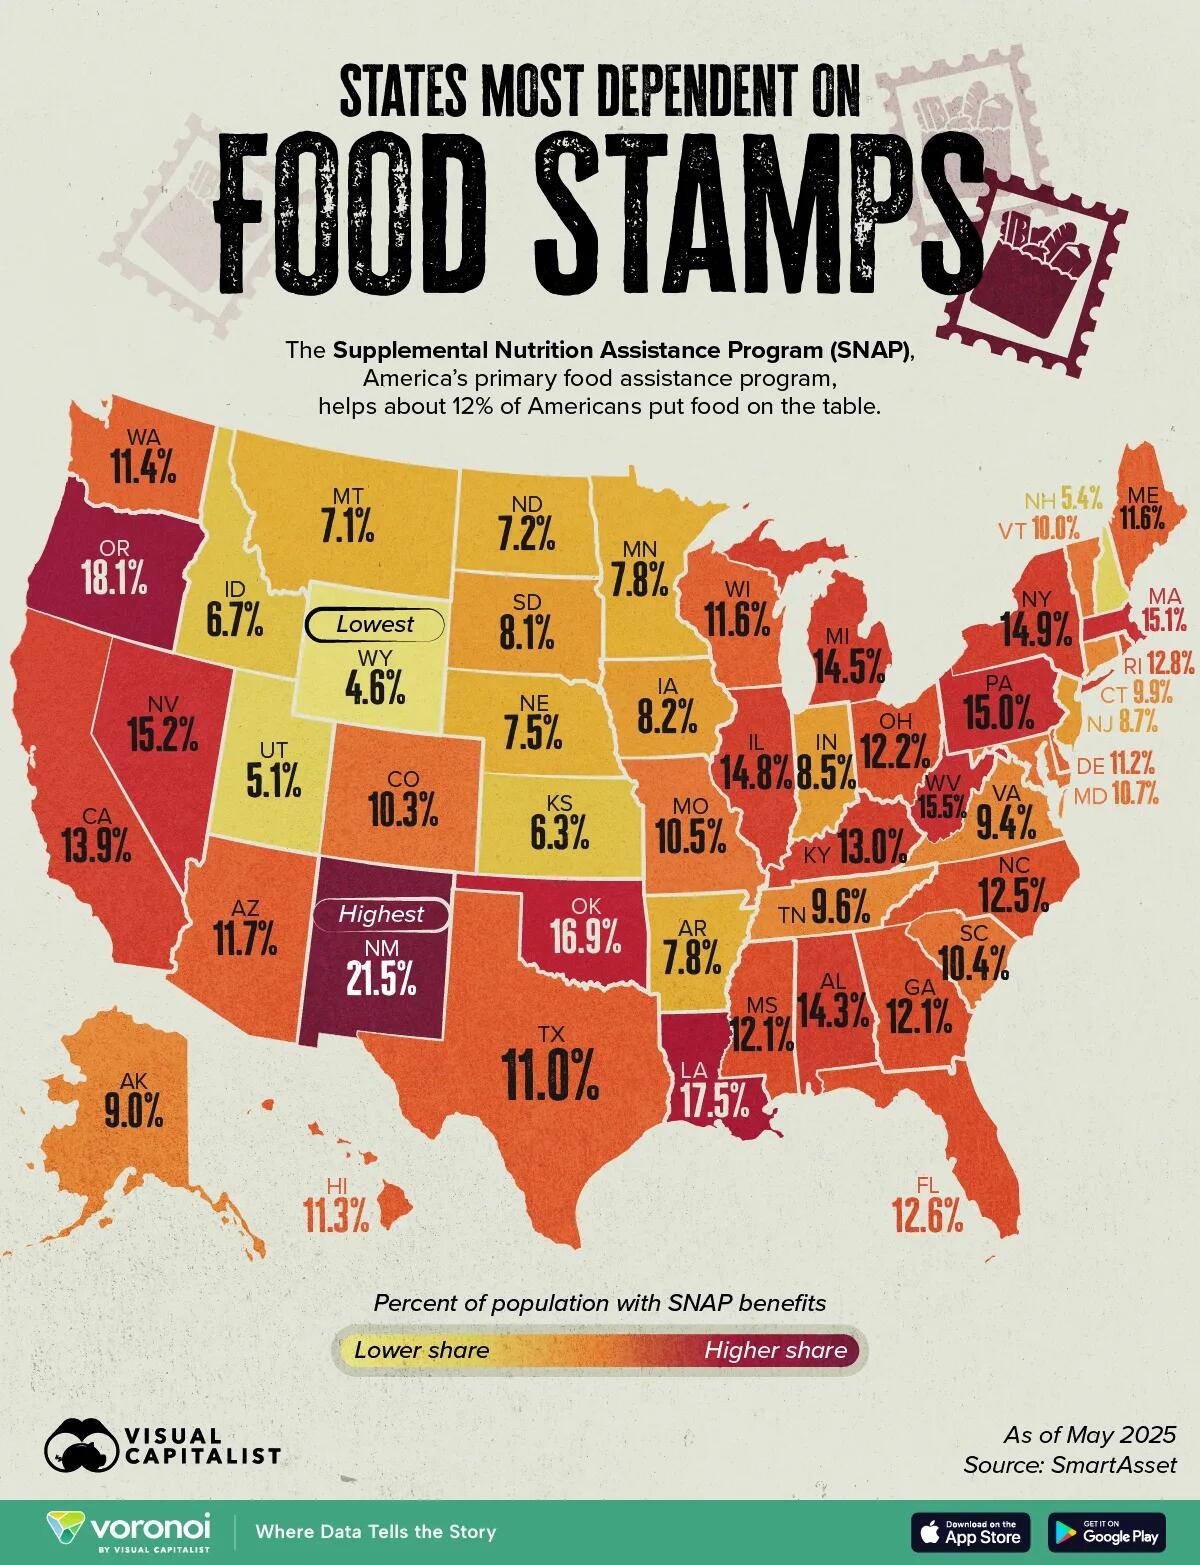
The Supplemental Nutrition Assistance Program (SNAP) is the largest federal food assistance initiative in the U.S., supporting roughly one in eight Americans. The program helps low-income households purchase groceries, with monthly benefits averaging around $180 per person nationwide.
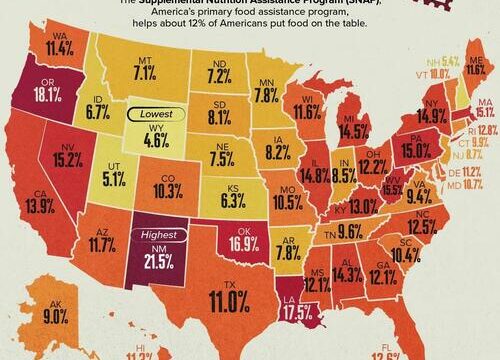
This visualization, via Visual Capitalist’s Bruno Venditti, highlights the states most reliant on food stamps, based on 2025 data from SmartAsset. While participation rates vary widely, the figures reveal stark contrasts in economic need and cost of living across states.
New Mexico Leads in SNAP Dependence
New Mexico stands out as the most SNAP-dependent state, with 21.5% of residents receiving assistance, nearly double the national average. The average monthly benefit there is $176.51 per person, totaling over $80 million in monthly aid. Persistent poverty rates and rural isolation help explain the state’s high reliance on federal food assistance.
Oregon follows closely at 18.1% enrollment, while Louisiana ranks third at 17.5%. In each case, elevated unemployment and cost pressures have contributed to continued demand for benefits.
Coastal and Urban States See Higher Benefit Amounts
States like New York ($218.44), Massachusetts ($215.64), and Hawaii ($361.78) report some of the highest average benefits per person. These higher payments reflect steeper living costs in dense urban and island economies.
Rank
State
Population with SNAP
Avg benefit per person
Number of beneficiaries
Total monthly benefits
1
New Mexico
21.5%
$176.51
457,699
$80,790,060
2
Oregon
18.1%
$182.17
772,893
$140,797,421
3
Louisiana
17.5%
$186.90
803,988
$150,268,544
4
Oklahoma
16.9%
$186.85
692,477
$129,386,266
5
W. Virginia
15.5%
$167.74
273,566
$45,886,908
6
Nevada
15.2%
$171.80
496,848
$85,360,880
7
Massachusetts
15.1%
$215.64
1,076,187
$232,066,810
8
Pennsylvania
15.0%
$181.70
1,958,047
$355,777,154
9
New York
14.9%
$218.44
2,962,913
$647,210,404
10
Illinois
14.8%
$195.94
1,879,564
$368,278,250
11
Michigan
14.5%
$175.44
1,473,832
$258,575,524
12
Alabama
14.3%
$193.08
736,178
$142,142,795
13
California
13.9%
$190.25
5,494,318
$1,045,310,679
14
Kentucky
13.0%
$178.94
595,155
$106,498,834
15
Rhode Island
12.8%
$200.95
142,726
$28,680,737
16
Florida
12.6%
$181.97
2,943,012
$535,551,777
17
North Carolina
12.5%
$174.75
1,378,291
$240,858,724
18
Ohio
12.2%
$186.03
1,450,955
$269,917,495
19
Georgia
12.1%
$186.08
1,356,493
$252,417,633
20
Mississippi
12.1%
$180.46
357,042
$64,432,174
21
Arizona
11.7%
$182.25
887,253
$161,705,602
22
Maine
11.6%
$176.55
163,520
$28,869,975
23
Wisconsin
11.6%
$163.89
689,315
$112,973,934
24
Washington
11.4%
$184.51
905,471
$167,068,578
25
Hawaii
11.3%
$361.78
163,576
$59,178,123
26
Delaware
11.2%
$180.54
118,209
$21,340,950
27
Texas
11.0%
$177.82
3,455,085
$614,386,464
28
Maryland
10.7%
$182.49
667,981
$121,902,010
29
Missouri
10.5%
$196.10
655,940
$128,629,589
30
South Carolina
10.4%
$186.42
567,895
$105,867,349
31
Colorado
10.3%
$195.97
614,843
$120,493,408
32
Vermont
10.0%
$188.75
64,633
$12,199,424
33
Connecticut
9.9%
$192.89
363,524
$70,118,853
34
Tennessee
9.6%
$203.20
690,545
$140,318,213
35
Virginia
9.4%
$173.84
824,866
$143,392,688
36
Alaska
9.0%
$364.31
66,377
$24,181,479
37
New Jersey
8.7%
$194.63
826,094
$160,778,766
38
Indiana
8.5%
$195.71
586,403
$114,763,019
39
Iowa
8.2%
$169.04
267,158
$45,159,537
40
South Dakota
8.1%
$198.24
75,282
$14,923,544
41
Minnesota
7.8%
$158.45
451,966
$71,616,027
42
Arkansas
7.8%
$172.82
239,748
$41,434,391
43
Nebraska
7.5%
$181.00
150,600
$27,258,920
44
North Dakota
7.2%
$174.33
57,129
$9,959,141
45
Montana
7.1%
$170.68
80,523
$13,743,731
46
Idaho
6.7%
$179.01
133,545
$23,906,189
47
Kansas
6.3%
$177.23
186,036
$32,971,957
48
New Hampshire
5.4%
$169.56
75,717
$12,838,748
49
Utah
5.1%
$192.17
177,087
$34,030,139
50
Wyoming
4.6%
$183.81
27,122
$4,985,385
In contrast, benefits tend to be smaller in lower-cost Midwestern states such as Wisconsin ($163.89) and Minnesota ($158.45), where overall food prices and housing costs are lower.
Low Participation in Western States
Wyoming has the lowest SNAP participation rate at just 4.6%, followed by Utah (5.1%) and New Hampshire (5.4%). Still, even in these states, food stamps remains a crucial safety net for tens of thousands of residents. Utah alone distributes more than $34 million in benefits each month to about 177,000 people.
If you enjoyed today’s post, check out The Longest Government Shutdown in U.S. History on Voronoi, the new app from Visual Capitalist.
Tyler Durden
Fri, 11/07/2025 – 22:10
https://www.zerohedge.com/personal-finance/new-mexico-state-most-dependent-food-stamps

