North Dakota & Texas Saw The Greatest GDP Growth Of US States Over The Past 35 Years, Louisiana The Least
The 1990s were a different time. Dial-up internet, gas costing a dollar, and many states still leaning on manufacturing.
Even then, new tech clusters and improved drilling methods were starting to reshape the map, setting up today’s energy-rich and tech-focused states for the strongest economies.
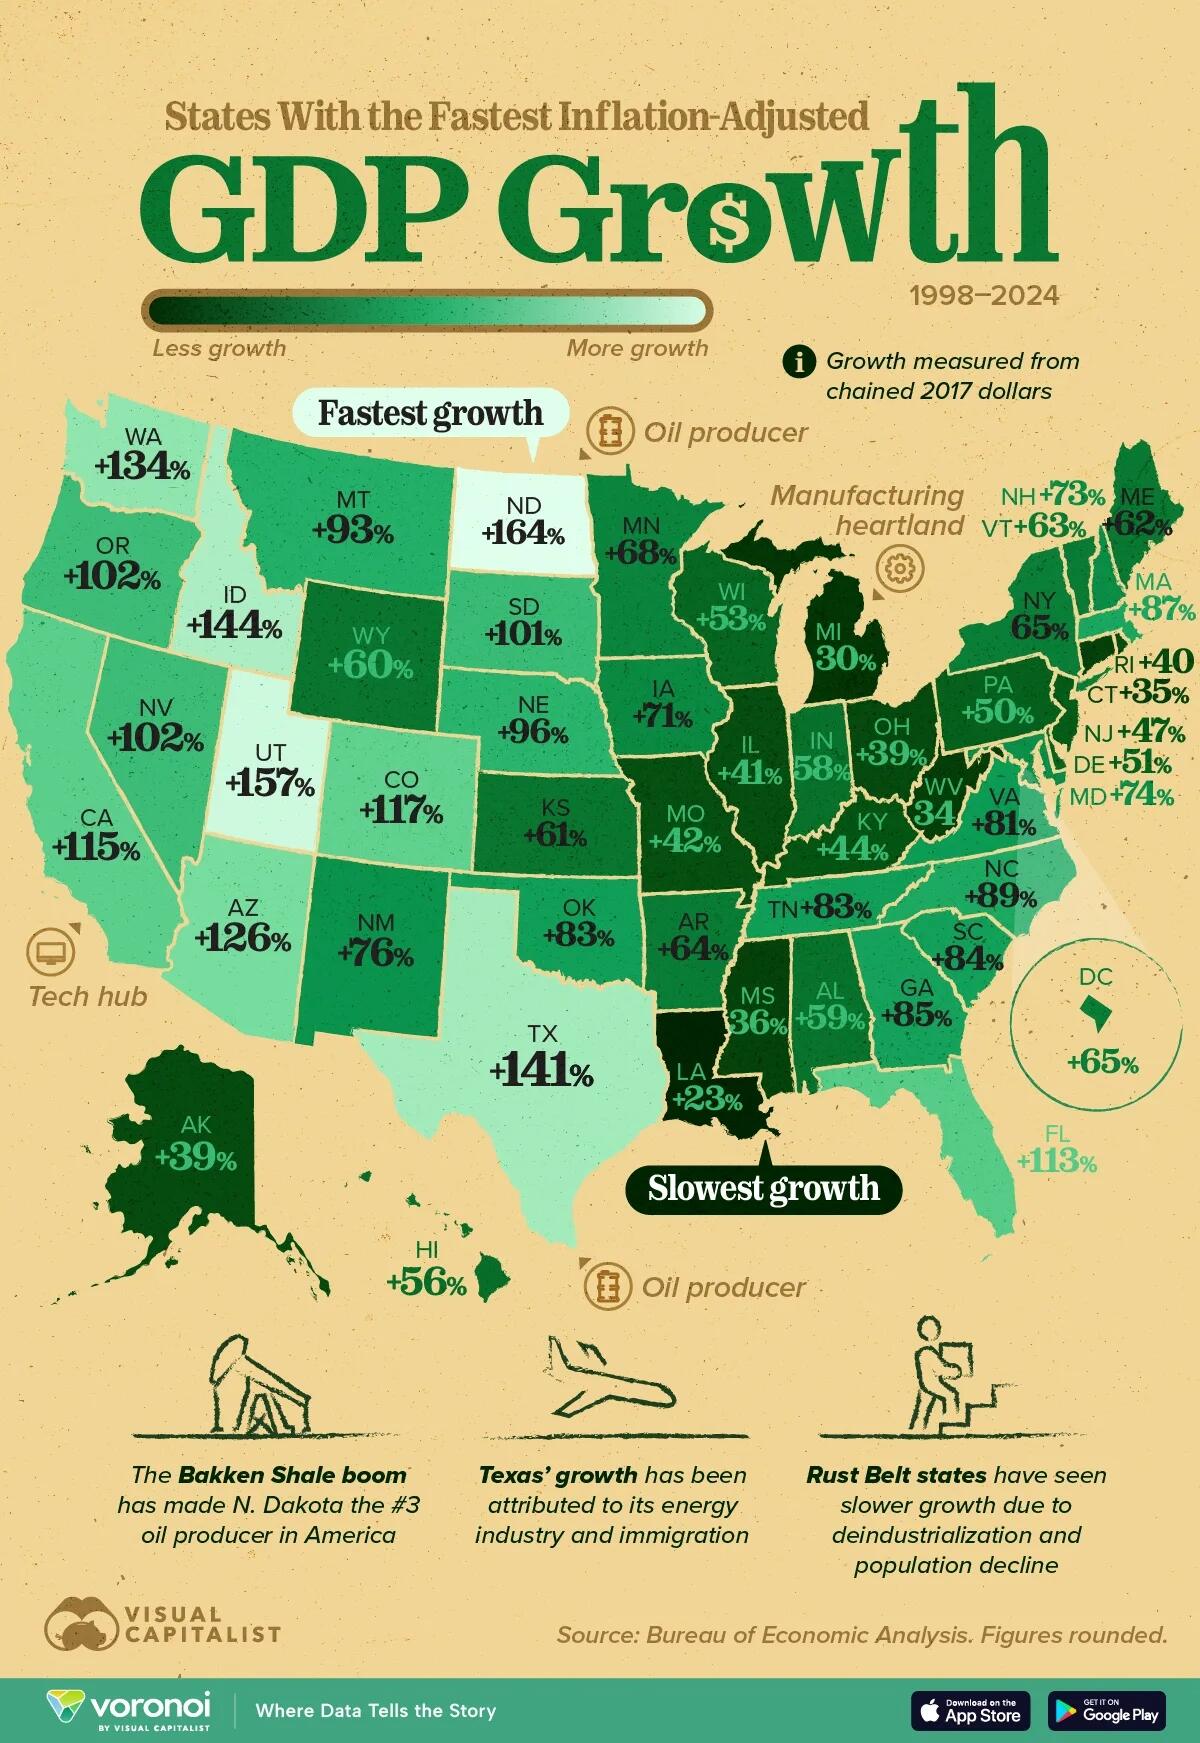
The visualization, via Visual Capitalist’s Pallavi Rao, ranks all 50 states and the District of Columbia by inflation-adjusted GDP growth between 1998–2024.
Data for real GDP growth by U.S. state is sourced from Bureau of Economic Analysis.
ℹ️ Real GDP growth measured from chained 2017 dollars.
America’s Shale Boom in One Map
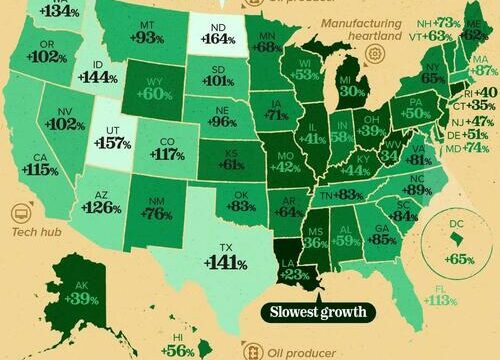
North Dakota’s economy more than doubled thanks to the Bakken shale boom, which lifted its real output by 164%—twice the U.S. average.
Texas, already the nation’s largest oil-producing state, followed closely with 141% growth.
Rank
State
State Code
GDP Growth (1998–2024)
CAGR
2024 GDP (Billions)
1
North Dakota
ND
164%
3.8%
$80,058
2
Utah
UT
157%
3.7%
$299,471
3
Idaho
ID
144%
3.5%
$129,018
4
Texas
TX
141%
3.4%
$2,769,766
5
Washington
WA
134%
3.3%
$856,014
6
Arizona
AZ
126%
3.2%
$570,089
7
Colorado
CO
117%
3.0%
$557,633
8
California
CA
115%
3.0%
$4,048,108
9
Florida
FL
113%
3.0%
$1,726,710
10
Oregon
OR
102%
2.7%
$330,250
11
Nevada
NV
102%
2.7%
$269,011
12
South Dakota
SD
101%
2.7%
$76,796
13
Nebraska
NE
96%
2.6%
$189,243
14
Montana
MT
93%
2.6%
$78,441
15
North Carolina
NC
89%
2.5%
$844,209
16
Massachusetts
MA
87%
2.4%
$778,523
17
Georgia
GA
85%
2.4%
$881,508
18
South Carolina
SC
84%
2.4%
$357,074
19
Oklahoma
OK
83%
2.4%
$263,695
20
Tennessee
TN
83%
2.3%
$561,201
21
Virginia
VA
81%
2.3%
$761,734
22
New Mexico
NM
76%
2.2%
$147,085
23
Maryland
MD
74%
2.2%
$546,028
24
New Hampshire
NH
73%
2.1%
$119,337
25
Iowa
IA
71%
2.1%
$265,795
26
Minnesota
MN
68%
2.0%
$507,688
27
New York
NY
65%
2.0%
$2,322,139
28
District of Columbia
DC
65%
1.9%
$184,298
29
Arkansas
AR
64%
1.9%
$188,340
30
Vermont
VT
63%
1.9%
$46,276
31
Maine
ME
62%
1.9%
$99,174
32
Kansas
KS
61%
1.9%
$230,522
33
Wyoming
WY
60%
1.8%
$51,498
34
Alabama
AL
59%
1.8%
$325,345
35
Indiana
IN
58%
1.8%
$519,517
36
Hawaii
HI
56%
1.7%
$117,627
37
Wisconsin
WI
53%
1.6%
$453,299
38
Delaware
DE
51%
1.6%
$110,972
39
Pennsylvania
PA
50%
1.6%
$1,007,874
40
New Jersey
NJ
47%
1.5%
$846,000
41
Kentucky
KY
44%
1.4%
$295,375
42
Missouri
MO
42%
1.4%
$448,714
43
Illinois
IL
41%
1.3%
$1,148,106
44
Rhode Island
RI
40%
1.3%
$80,381
45
Ohio
OH
39%
1.3%
$923,141
46
Alaska
AK
39%
1.3%
$71,567
47
Mississippi
MS
36%
1.2%
$158,192
48
Connecticut
CT
35%
1.2%
$356,835
49
West Virginia
WV
34%
1.1%
$106,475
50
Michigan
MI
30%
1.0%
$702,467
51
Louisiana
LA
23%
0.8%
$329,173
N/A
U.S.
USA
81%
2.3%
$29,298,013
New Mexico and Oklahoma also landed in the top 20. Cheap feedstock, rising exports of liquefied natural gas (LNG), and associated midstream build-out helped these states capture much of the value created by soaring U.S. energy production.
ℹ️ Related: New Mexico overtook North Dakota as the second-largest oil producing U.S. state.
Tech & Tourism Hubs Sustain Rapid Expansion
Utah (+157%), Idaho (+144%), and Washington (+134%) show how a diversified tech sector can supercharge state-level GDP.
Microsoft’s cloud push, Idaho’s semiconductor fabs, and Utah’s “Silicon Slopes” collectively fostered high-wage job growth and attracted inbound migration.
Even the giant economies of California (+115%) and Florida (+113%) managed to outpace the national average rate of GDP growth by U.S. states. This shows how tech and professional-services clusters spill over into broader economic activity.
Rust Belt and Coastal Laggards
Manufacturing-heavy states in the Midwest and Appalachia largely underperformed. Michigan (+30%) and West Virginia (+34%) never fully recovered the industrial output lost after the early-2000s recession and the Great Financial Crisis.
Connecticut (+35%) and New Jersey (+47%) illustrate how high costs and slow demographic growth weighed on East Coast economies.
Louisiana, hit by multiple hurricanes and refinery shutdowns, posted the slowest gain at just 23%, one-quarter of the national pace.
If you enjoyed today’s post, check out The World’s Largest Economies, Including U.S. States on Voronoi, the new app from Visual Capitalist.
Tyler Durden
Fri, 11/07/2025 – 20:30

