
Visualizing The Size Of Each Country’s Shadow Economy
The global shadow economy generates trillions in revenue each year, driven by criminal activity and other unreported transactions.
In low income countries, shadow activity makes up a larger slice of GDP, standing at an estimated 42.4% share. In comparison, this drops to 5.9% of GDP in rich countries, with the UAE seeing the smallest share overall.
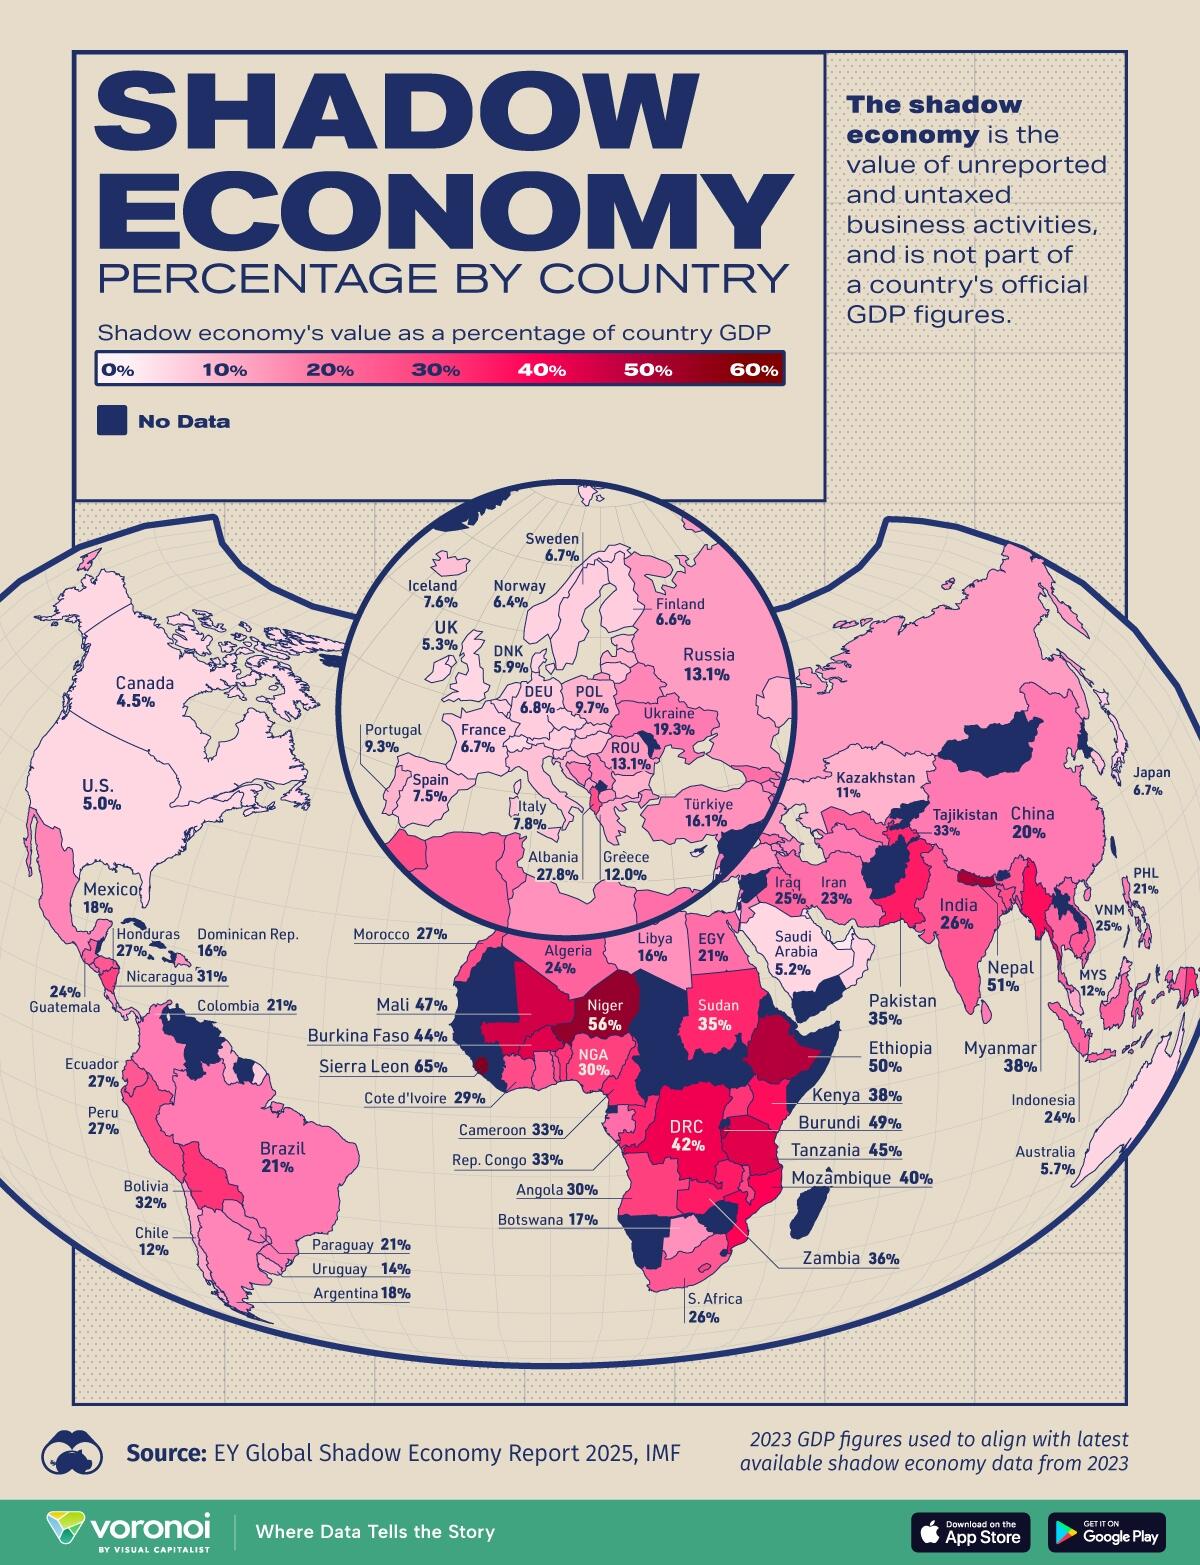
This graphic, via Visual Capitalist’s Dorothy Neufeld, shows the size of each country’s shadow economy, based on analysis from the Ernst & Young Global Shadow Economy Report 2025.
Defining the Shadow Economy
To start, the shadow economy includes unreported or untaxed activity, making it difficult for authorities to monitor.
This includes illegal enterprises, drug trafficking, street vendors, or cash transactions made off the books. While measuring the informal economy is hard to quantify, it has shrunk from 17.7% of world GDP in 2000 to 11.8% in 2023.
Breaking Down the Shadow Economy by Country
Here are countries with the largest shadow economies as a share of GDP:
Rank
Country
Shadow Economy
% of GDP in 2023
Shadow Economy Value
GDP 2023
1
🇸🇱 Sierra Leone
64.5
$4.1B
$6.4B
2
🇳🇪 Niger
56.3
$9.5B
$16.8B
3
🇳🇵 Nepal
51.0
$20.9B
$40.9B
4
🇪🇹 Ethiopia
50.2
$80.2B
$159.8B
5
🇧🇮 Burundi
49.2
$2.1B
$4.2B
6
🇲🇱 Mali
46.8
$9.5B
$20.2B
7
🇹🇿 Tanzania
44.7
$35.4B
$79.1B
8
🇧🇫 Burkina Faso
43.8
$8.9B
$20.3B
9
🇨🇩 DRC
42.1
$28.2B
$66.9B
10
🇲🇿 Mozambique
39.8
$8.4B
$21.0B
11
🇰🇪 Kenya
38.4
$41.8B
$108.8B
12
🇲🇲 Myanmar
37.9
$24.4B
$64.5B
13
🇿🇲 Zambia
35.6
$10.0B
$28.2B
14
🇵🇰 Pakistan
35.0
$118.1B
$337.5B
15
🇸🇩 Sudan
34.9
$13.3B
$38.1B
16
🇨🇲 Cameroon
33.3
$16.4B
$49.3B
17
🇹🇯 Tajikistan
33.2
$4.0B
$11.9B
18
🇧🇯 Benin
32.9
$6.5B
$19.7B
19
🇨🇬 Congo
32.6
$4.6B
$14.2B
20
🇧🇴 Bolivia
32.1
$14.6B
$45.5B
21
🇵🇬 Papua New Guinea
31.4
$9.6B
$30.7B
22
🇺🇬 Uganda
31.1
$15.2B
$48.8B
23
🇱🇸 Lesotho
30.9
$0.6B
$2.1B
24
🇲🇼 Malawi
30.9
$3.9B
$12.7B
25
🇳🇮 Nicaragua
30.7
$5.5B
$17.8B
26
🇦🇴 Angola
30.2
$25.6B
$84.8B
27
🇳🇬 Nigeria
30.0
$109.1B
$363.8B
28
🇧🇩 Bangladesh
29.0
$126.8B
$437.4B
29
🇨🇮 Cote d’Ivoire
28.8
$22.7B
$78.9B
30
🇹🇬 Togo
28.1
$2.6B
$9.2B
31
🇦🇱 Albania
27.8
$6.5B
$23.5B
32
🇵🇪 Peru
27.1
$72.5B
$267.6B
33
🇲🇦 Morocco
27.0
$39.0B
$144.4B
34
🇬🇭 Ghana
26.8
$20.5B
$76.4B
35
🇭🇳 Honduras
26.7
$9.2B
$34.4B
36
🇪🇨 Ecuador
26.5
$31.5B
$118.8B
37
🇰🇭 Cambodia
26.4
$11.2B
$42.3B
38
🇿🇦 South Africa
26.3
$100.1B
$380.7B
39
🇮🇳 India
26.1
$931.1B
$3,567.6B
40
🇻🇳 Vietnam
25.1
$107.9B
$429.7B
41
🇮🇶 Iraq
24.8
$62.2B
$250.8B
42
🇺🇿 Uzbekistan
24.4
$24.8B
$101.6B
43
🇬🇹 Guatemala
24.3
$25.4B
$104.5B
44
🇩🇿 Algeria
24.2
$59.9B
$247.6B
45
🇹🇭 Thailand
24.0
$123.6B
$515.0B
46
🇮🇩 Indonesia
23.8
$326.3B
$1,371.2B
47
🇬🇦 Gabon
23.1
$4.5B
$19.4B
48
🇮🇷 Iran
22.5
$91.0B
$404.6B
49
🇬🇪 Georgia
22.1
$6.8B
$30.8B
50
🇪🇬 Egypt
21.2
$84.0B
$396.0B
51
🇹🇳 Tunisia
21.2
$10.3B
$48.5B
52
🇨🇴 Colombia
20.9
$76.0B
$363.5B
53
🇵🇾 Paraguay
20.9
$9.0B
$43.0B
54
🇵🇭 Philippines
20.7
$90.5B
$437.1B
55
🇧🇷 Brazil
20.6
$447.8B
$2,173.7B
56
🇨🇳 China
20.3
$3,612.3B
$17,794.8B
57
🇱🇰 SriLanka
20.1
$17.0B
$84.4B
58
🇸🇻 El Salvador
19.9
$6.8B
$34.0B
59
🇹🇲 Turkmenistan
19.7
$11.9B
$60.6B
60
🇱🇧 Lebanon
19.6
N/A
N/A
61
🇺🇦 Ukraine
19.3
$34.5B
$178.8B
62
🇦🇲 Armenia
18.9
$4.6B
$24.1B
63
🇧🇦 Bosnia and Herzegovina
18.6
$5.1B
$27.5B
64
🇧🇾 Belarus
18.3
$13.2B
$71.9B
65
🇯🇴 Jordan
18.3
$9.3B
$51.0B
66
🇲🇽 Mexico
17.9
$320.2B
$1,789.1B
67
🇦🇷 Argentina
17.8
$115.0B
$646.1B
68
🇦🇿 Azerbaijan
17.7
$12.8B
$72.4B
69
🇷🇸 Serbia
17.2
$14.0B
$81.3B
70
🇧🇼 Botswana
17.0
$3.3B
$19.4B
71
🇲🇰 North Macedonia
16.9
$2.7B
$15.8B
72
🇱🇾 Libya
16.3
$7.4B
$45.1B
73
🇩🇴 Dominican Republic
16.2
$19.7B
$121.4B
74
🇹🇷 Türkiye
16.1
$180.0B
$1,118.3B
75
🇨🇷 Costa Rica
13.8
$11.9B
$86.5B
76
🇲🇪 Montenegro
13.6
$1.0B
$7.5B
77
🇺🇾 Uruguay
13.5
$10.4B
$77.2B
78
🇷🇴 Romania
13.1
$46.0B
$350.8B
79
🇷🇺 Russia
13.1
$264.8B
$2,021.4B
80
🇲🇾 Malaysia
12.3
$49.2B
$399.7B
81
🇵🇦 Panama
12.1
$10.1B
$83.3B
82
🇬🇷 Greece
12.0
$29.2B
$243.5B
83
🇨🇱 Chile
11.9
$39.9B
$335.5B
84
🇬🇾 Guyana
11.8
$2.0B
$17.2B
85
🇰🇿 Kazakhstan
11.2
$29.4B
$262.6B
86
🇲🇺 Mauritius
10.6
$1.5B
$14.6B
87
🇧🇬 Bulgaria
10.5
$10.8B
$102.4B
88
🇵🇷 Puerto Rico
10.3
$12.1B
$117.9B
89
🇵🇱 Poland
9.7
$78.5B
$809.2B
90
🇭🇷 Croatia
9.3
$7.8B
$84.4B
91
🇱🇻 Latvia
9.3
$3.9B
$42.2B
92
🇵🇹 Portugal
9.3
$26.9B
$289.1B
93
🇭🇺 Hungary
9.2
$19.5B
$212.4B
94
🇸🇰 Slovak Republic
8.9
$11.8B
$132.9B
95
🇳🇿 New Zealand
8.2
$20.7B
$252.2B
96
🇸🇮 Slovenia
8.0
$5.5B
$69.1B
97
🇮🇹 Italy
7.8
$179.5B
$2,300.9B
98
🇮🇸 Iceland
7.6
$2.4B
$31.3B
99
🇰🇷 Korea
7.6
$130.2B
$1,712.8B
100
🇲🇹 Malta
7.5
$1.7B
$22.3B
101
🇪🇸 Spain
7.5
$121.5B
$1,620.1B
102
🇪🇪 Estonia
7.4
$3.1B
$41.3B
103
🇱🇹 Lithuania
7.4
$5.9B
$79.8B
104
🇩🇪 Germany
6.8
$307.7B
$4,525.7B
105
🇫🇷 France
6.7
$204.5B
$3,051.8B
106
🇯🇵 Japan
6.7
$281.7B
$4,204.5B
107
🇸🇪 Sweden
6.7
$39.2B
$585.0B
108
🇦🇹 Austria
6.6
$33.8B
$511.7B
109
🇧🇪 Belgium
6.6
$42.6B
$644.8B
110
🇫🇮 Finland
6.6
$19.5B
$295.5B
111
🇨🇿 Czechia
6.5
$22.3B
$343.2B
112
🇳🇴 Norway
6.4
$31.1B
$485.3B
113
🇴🇲 Oman
6.4
$7.0B
$108.8B
114
🇳🇱 Netherlands
6.3
$72.7B
$1,154.4B
115
🇱🇺 Luxembourg
6.1
$5.2B
$85.8B
116
🇩🇰 Denmark
5.9
$24.0B
$407.1B
117
🇦🇺 Australia
5.7
$98.5B
$1,728.1B
118
🇮🇱 Israel
5.5
$28.2B
$513.6B
119
🇧🇸 Bahamas
5.4
$0.8B
$14.3B
120
🇨🇾 Cyprus
5.3
$1.8B
$33.9B
121
🇬🇧 UK
5.3
$179.2B
$3,380.9B
122
🇸🇦 Saudi Arabia
5.2
$55.5B
$1,067.6B
123
🇮🇪 Ireland
5.1
$28.1B
$551.4B
124
🇨🇭 Switzerland
5.1
$45.1B
$884.9B
125
🇺🇸 United States
5.0
$1,386.0B
$27,720.7B
126
🇨🇦 Canada
4.5
$96.4B
$2,142.5B
127
🇰🇼 Kuwait
4.0
$6.5B
$163.7B
128
🇸🇬 Singapore
3.4
$17.0B
$501.4B
129
🇧🇭 Bahrain
2.5
$1.2B
$46.1B
130
🇶🇦 Qatar
2.2
$4.7B
$213.0B
131
🏳️ UAE
2.1
$10.8B
$514.1B
As we can see, Sierra Leone ranks first overall, with its shadow economy equaling 64.5% of GDP.
Like many other sub-Saharan African countries, the informal economy employs millions of workers, including subsistence farmers, street vendors, and small business owners. Underscoring this trend are limited opportunities in the formal sector along with bureaucratic red tape.
In particular, the DRC stands out in both the scale of its informal economy and prevalence of organized crime.
Meanwhile, Nepal ranks third overall, with shadow activity accounting for 51% of GDP. Notably, the agriculture sector employs a substantial share of informal workers. In fact, 85% of Nepal’s labor force participates in the informal economy, making it a vital source of livelihood for many.
In contrast, America’s underground economy comprises just 5% of GDP, yet its sheer size—valued at $1.4 trillion—makes it one of the world’s largest.
To learn more about this topic from a violent crime perspective, check out this graphic on violent crime rates by U.S. state.
Tyler Durden
Wed, 05/14/2025 – 04:15
https://www.zerohedge.com/personal-finance/visualizing-size-each-countrys-shadow-economy