
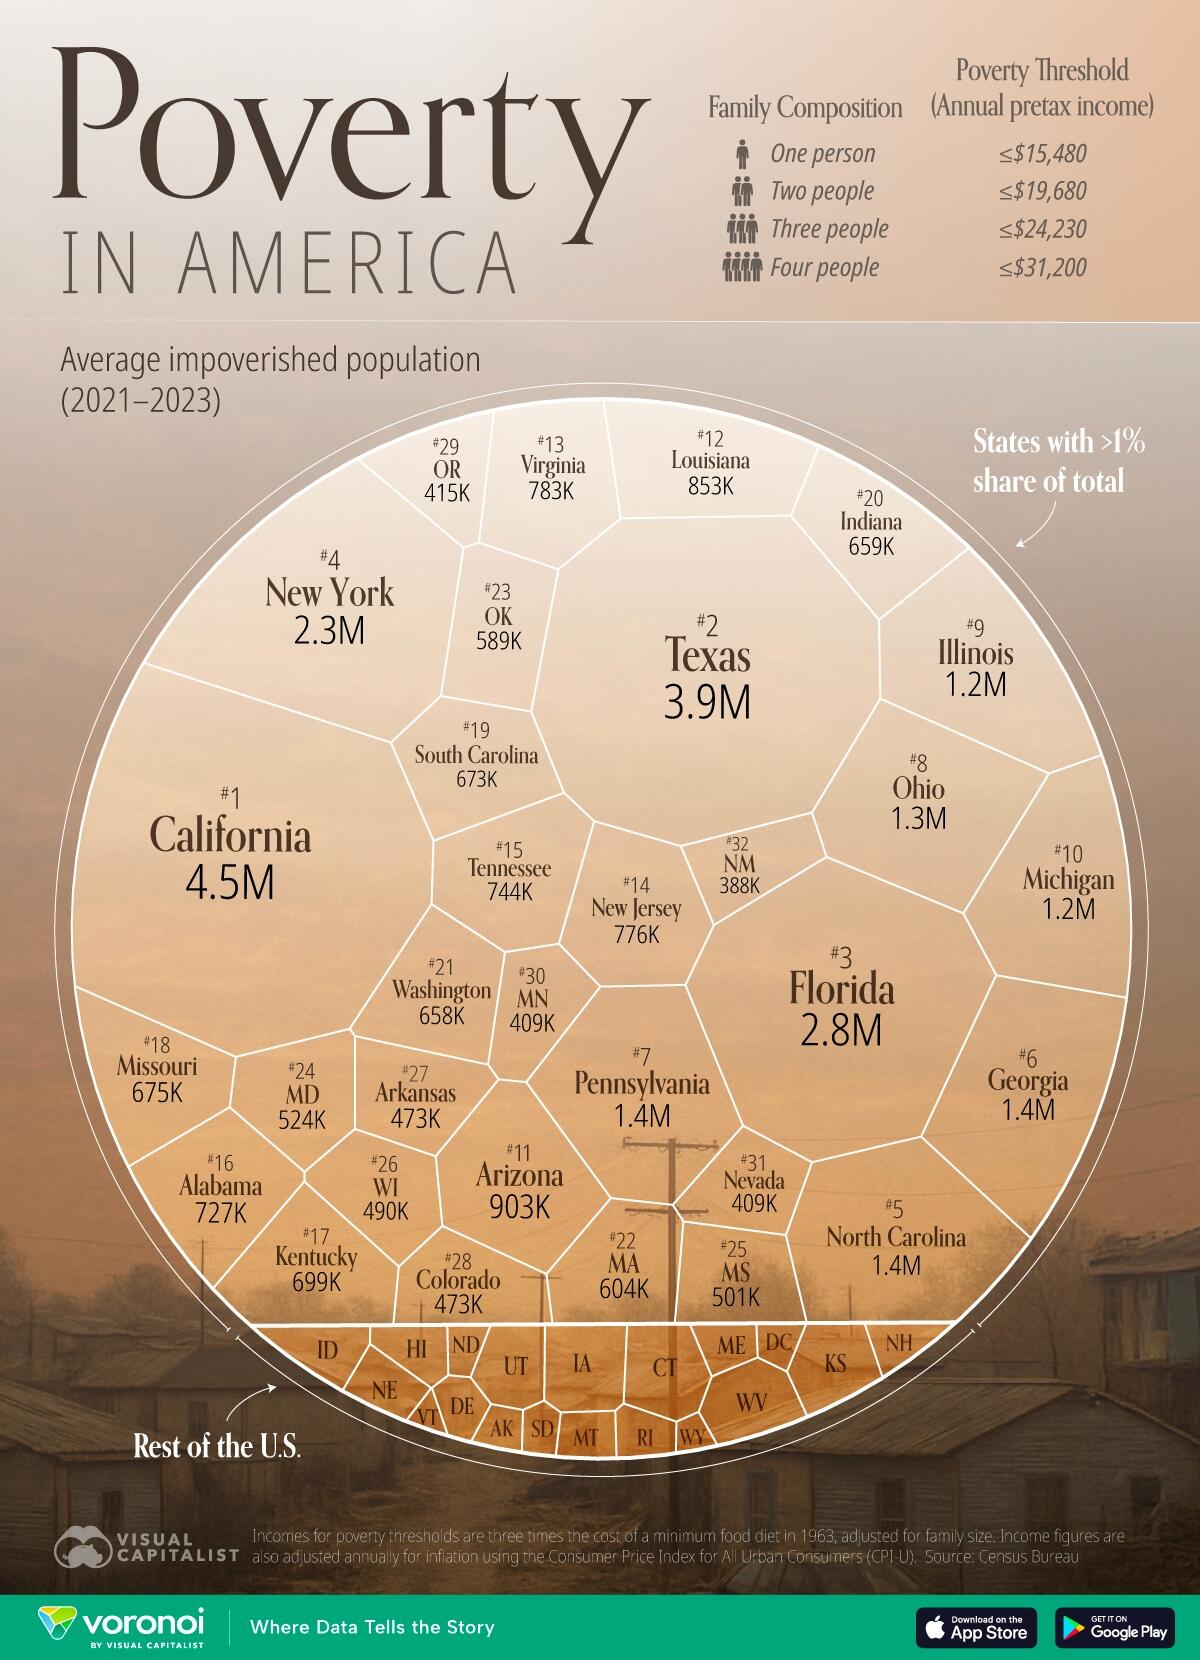
Where Are The Poor In America?
America loves to tally its billionaires and track the S&P’s every tick, but the millions struggling to cover rent or stock the fridge rarely make the headline scroll.
Poverty is the country’s most persistent invisibility cloak, present in every zip code, yet ignored in a culture that equates success with worth.
In this chart Visual Capitalist’s Pallavi Rao breaks down where the poor in America actually live, ranked by each state.
Data for this visualization is sourced from the U.S. Census Bureau.
It averages three years of Current Population Survey results (2021-2023) to estimate how many residents in each state live below the federal poverty line.
Read the last section for more information on their methodology.
Ranked: U.S. States by Residents in Poverty
Four populous states—California, Texas, Florida, and New York—account for 13.5 million low-income residents, or more than one-third of all Americans in poverty.
California alone has 4.5 million people struggling to make ends meet, roughly the population of metropolitan Phoenix.
Rank
State
# in Poverty
(Thousands, Sortable)
# in Poverty
(Readable)
Share of All
Americans in Poverty
1
California
4,521
4.5M
12.0
2
Texas
3,910
3.9M
10.4
3
Florida
2,782
2.8M
7.4
4
New York
2,349
2.3M
6.2
5
North Carolina
1,416
1.4M
3.8
6
Georgia
1,400
1.4M
3.7
7
Pennsylvania
1,351
1.4M
3.6
8
Ohio
1,272
1.3M
3.4
9
Illinois
1,245
1.2M
3.3
10
Michigan
1,186
1.2M
3.2
11
Arizona
903
903K
2.4
12
Louisiana
853
853K
2.3
13
Virginia
783
783K
2.1
14
New Jersey
776
776K
2.1
15
Tennessee
744
744K
2.0
16
Alabama
727
727K
1.9
17
Kentucky
699
699K
1.9
18
Missouri
675
675K
1.8
19
South Carolina
673
673K
1.8
20
Indiana
659
659K
1.8
21
Washington
658
658K
1.7
22
Massachusetts
604
604K
1.6
23
Oklahoma
589
589K
1.6
24
Maryland
524
524K
1.4
25
Mississippi
501
501K
1.3
26
Wisconsin
490
490K
1.3
27
Arkansas
473
473K
1.3
28
Colorado
473
473K
1.3
29
Oregon
415
415K
1.1
30
Minnesota
409
409K
1.1
31
Nevada
409
409K
1.1
32
New Mexico
388
388K
1.0
33
Connecticut
318
318K
0.8
34
Iowa
287
287K
0.8
35
West Virginia
268
268K
0.7
36
Kansas
255
255K
0.7
37
Utah
226
226K
0.6
38
Idaho
172
172K
0.5
39
Nebraska
165
165K
0.4
40
Hawaii
133
133K
0.4
41
Maine
120
120K
0.3
42
Montana
109
109K
0.3
43
Delaware
98
98K
0.3
44
New Hampshire
98
98K
0.3
45
Rhode Island
96
96K
0.3
46
District of Columbia
88
88K
0.2
47
Alaska
74
74K
0.2
48
South Dakota
74
74K
0.2
49
North Dakota
72
72K
0.2
50
Vermont
49
49K
0.1
51
Wyoming
49
49K
0.1
N/A
🇺🇸 U.S.
37,610
37.6M
N/A
While the Golden State’s higher cost of living may impact this figure, it also underscores how expensive housing can compound economic hardship, even in high-income states.
Fact: People in California have the lowest purchasing power in the country.
Poverty Rates vs. Absolute Numbers
A fair criticism of this visualization is that it doesn’t account for population.
We previously mapped out poverty rates by state in the country to help cover this angle. The table below has the relevant figures.
Rank
State
State Code
Share of Population
in Poverty
# in Poverty
1
Louisiana
LA
18.9%
853K
2
New Mexico
NM
18.5%
388K
3
Mississippi
MS
17.3%
501K
4
Arkansas
AR
15.8%
473K
5
Kentucky
KY
15.7%
699K
6
West Virginia
WV
15.3%
268K
7
Oklahoma
OK
14.9%
589K
8
Alabama
AL
14.6%
727K
9
District of Columbia
DC
13.4%
88K
10
North Carolina
NC
13.2%
1.4M
11
Texas
TX
13.1%
3.9M
12
Georgia
GA
12.9%
1.4M
13
Nevada
NV
12.9%
409K
14
South Carolina
SC
12.7%
673K
15
Florida
FL
12.5%
2.8M
16
Arizona
AZ
12.4%
903K
17
New York
NY
12.1%
2.3M
18
Michigan
MI
11.9%
1.2M
19
California
CA
11.7%
4.5M
20
Missouri
MO
11.1%
675K
21
Ohio
OH
10.9%
1.3M
22
Pennsylvania
PA
10.7%
1.4M
23
Tennessee
TN
10.6%
744K
24
Alaska
AK
10.4%
74K
25
Illinois
IL
10%
1.2M
26
Oregon
OR
9.8%
415K
27
Indiana
IN
9.7%
659K
28
Montana
MT
9.7%
109K
29
Delaware
DE
9.6%
98K
30
Hawaii
HI
9.3%
133K
31
North Dakota
ND
9.3%
72K
32
Virginia
VA
9.2%
783K
33
Iowa
IA
9%
287K
34
Idaho
ID
8.9%
172K
35
Kansas
KS
8.9%
255K
36
Rhode Island
RI
8.9%
96K
37
Connecticut
CT
8.8%
318K
38
Massachusetts
MA
8.8%
604K
39
Maine
ME
8.7%
120K
40
Wyoming
WY
8.6%
49K
41
Maryland
MD
8.5%
524K
42
Washington
WA
8.5%
658K
43
Nebraska
NE
8.4%
165K
44
New Jersey
NJ
8.4%
776K
45
Wisconsin
WI
8.4%
490K
46
South Dakota
SD
8.3%
74K
47
Colorado
CO
8.2%
473K
48
Vermont
VT
7.7%
49K
49
Minnesota
MN
7.2%
409K
50
New Hampshire
NH
7.1%
98K
51
Utah
UT
6.7%
226K
N/A
U.S.
US
11.4%
37.6M
In fact, California’s poverty rate is 12%, solidly middle of the pack.
But its 4.6 million poor residents are larger than the entire state of Oklahoma.
By contrast, Mississippi’s headline-grabbing 17% rate represents about 500,000 people.
Thus, a national food-assistance program needs almost nine times the meal budget for California, even though Mississippi is poorer than California.
Even within similar rate bands, scale varies wildly: Louisiana (18.9%) has 853,000 million people in poverty, compared with 388,000 in New Mexico (18.5%).
Thus, absolute numbers are also necessary to flag where to park mobile clinics, expand SNAP distribution sites, and hire caseworkers.
Fact: New Mexico also has the highest share of households on income or food support.
How Poverty is Measured in America
The way the Census Bureau calculates this line is important and can impact the data.
They use pretax household income against a threshold at three times the cost of a minimum food diet from 1963, adjusted for family size and inflation.
For reference, this is a quick guide on how much a household needs to be earning to be considered below the poverty line in 2023.
One person: ≤$15,480
Two people: ≤$19,680
Three people: ≤$24,230
Four people: ≤$31,200
If you enjoyed today’s post, check out What is Costs to Buy a Home in America on Voronoi, the new app from Visual Capitalist.
Tyler Durden
Mon, 09/29/2025 – 23:15
https://www.zerohedge.com/personal-finance/where-are-poor-america

